
Cyber Monitoring
Navigation to Cyber Monitoring
To navigate your way to the Cyber Monitoring Dashboard, you must click the redirect icon ![]() beside the "Cyber Monitoring" title.
beside the "Cyber Monitoring" title.

This will then redirect you to the dashboard as seen below.
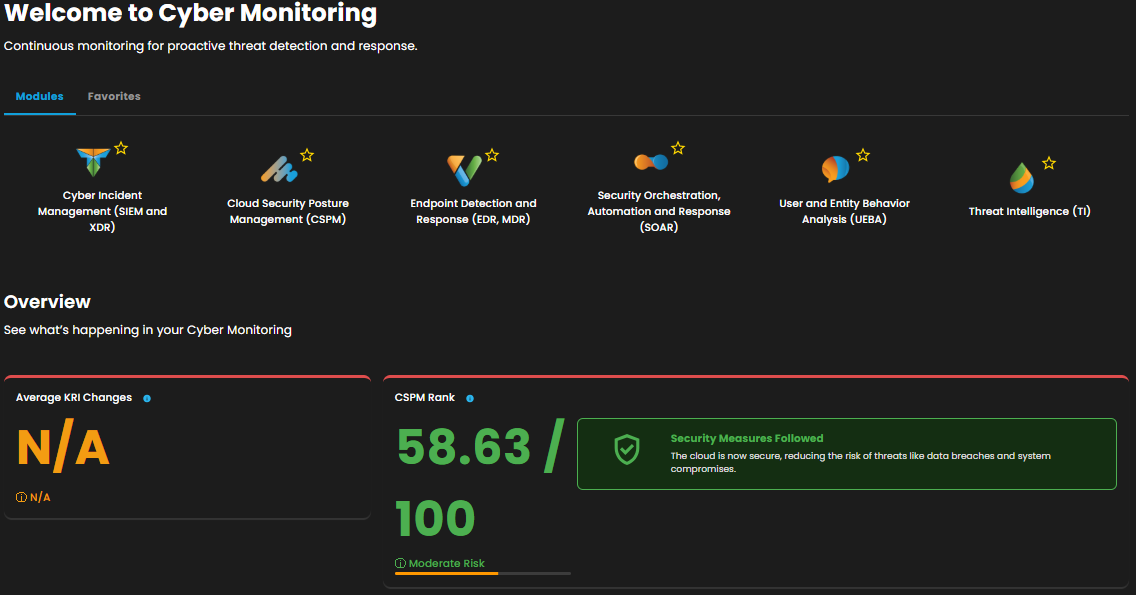 Here you will see the 6 modules:
- Cyber Incident Management (SIEM and XDR)
- Cloud Security Posture Management (CSPM)
- Endpoint Detection and Response (EDR, MDR)
- Security Orchestration, Automation and Response (SOAR)
- User and Entity Behavior Analysis (UEBA)
- Threat Intelligence (TI)
By clicking on their icons, you will be redirected to the modules' "Main Page" section.
Below the modules, you will find the overview.
Average Key Risk Indicator (KRI) Changes
Understanding the volume of digital assets within your environment is fundamental to managing cyber risk. The total number of assets reflects the scale of your digital footprint and highlights potential vectors for exploitation. By quantifying these assets, organizations gain clarity on how broad their exposure surface truly is. This visibility allows teams to prioritize defenses, allocate resources effectively, and reduce blind spots. Recognizing the scope of what’s connected is the first step toward controlling it.

CSPM Rank
Understanding the state of your cloud security is critical. The Cloud Security Posture Management (CSPM) score provides a quantifiable snapshot of how securely your cloud environments are configured. It reflects alignment with established best practices and recognized security standards, offering a clear benchmark for posture maturity. By highlighting deviations, gaps, or misconfigurations, the score empowers teams to prioritize remediation efforts based on risk impact. This metric doesn’t just inform—it drives accountability and continuous improvement, giving organizations the visibility needed to evolve with confidence in an ever-changing threat landscape.

Cases
This section shows the overview of your cases to help you prioritize.
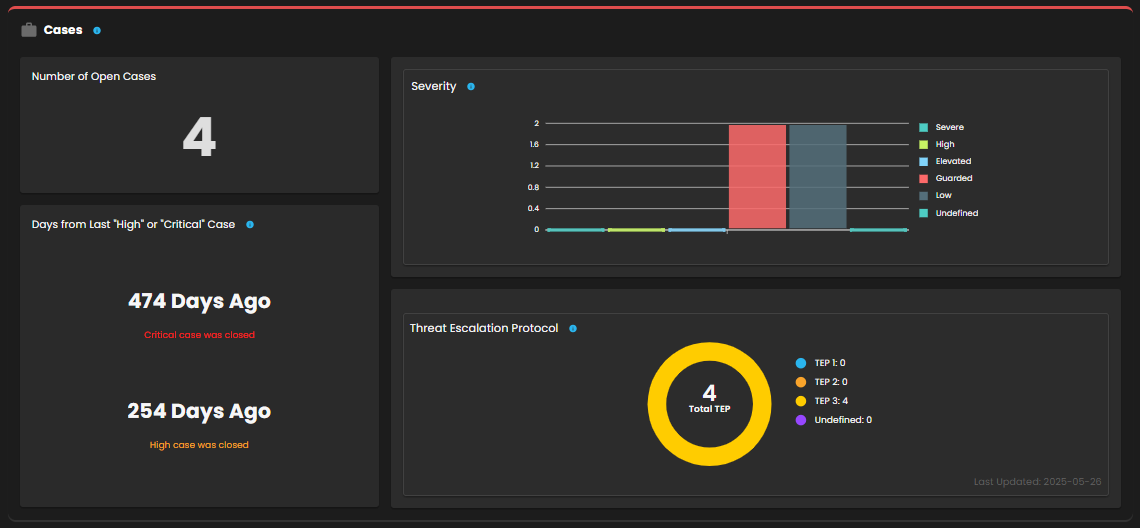

This shows how man days have passed since the last detection of high or critical-level monitoring alerts. A shorter duration may indicate persistent or recent serious threats.

This displays the distribution of active cases based on severity levels (Severe, High, Elevated, Guarded, and Low). This helps prioritize response efforts based on urgency.
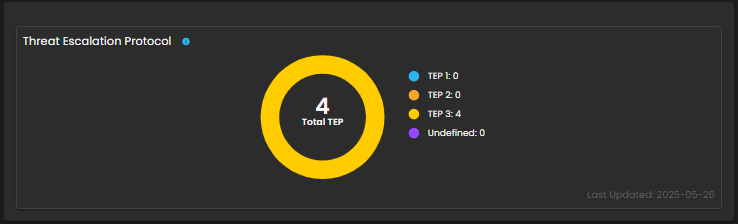
This shows the total number of open cases grouped by Threat Escalation Protocol (TEP) stages. This also indicates how threats are progressing through the defined escalation process.
