
Cyber Incident Management (SIEM and XDR)
Welcome to the Cyber Incident Management Dashboard module.
The Main Dashboard serves as the central hub for viewing all critical and relevant data associated with this module. It provides a consolidated interface where key metrics, updates, and operational insights are displayed for quick reference and effective monitoring.

Case Categories
This panel displays and categorizes all cases within your environment that are currently open or in progress. It presents a structured view based on case categories, offering a clear summary of ongoing activity. This allows for efficient tracking, prioritization, and management of active investigations

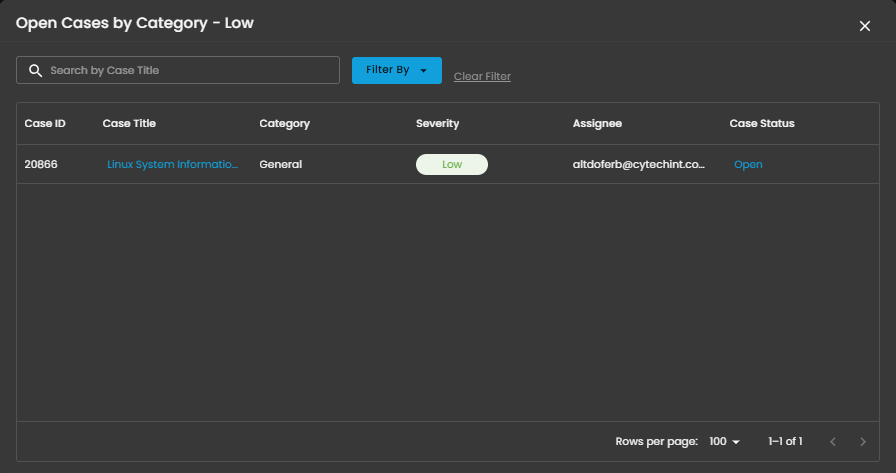
Upon selecting a category, a new window will automatically open, displaying all cases associated with the selected category.

- Search Bar: The search bar enables users to locate a specific case by entering the exact case title. Simply type the desired title into the search field to quickly retrieve relevant results.
- Filter By & Clear Filter: This feature enables users to refine the list of cases by applying filters based on Severity and Case Status. Use the Filter By option to display only the cases that match specific criteria. To remove all applied filters and return to the full list of cases, use the Clear Filter option.


- Case Details: To access the investigation section of a case, double-click on the case entry. This action will automatically redirect you to the detailed investigation interface for further analysis and review.


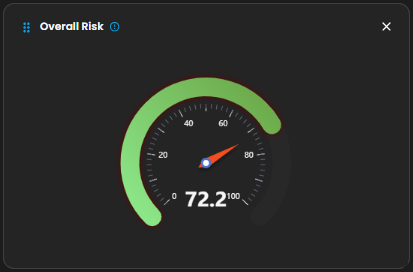
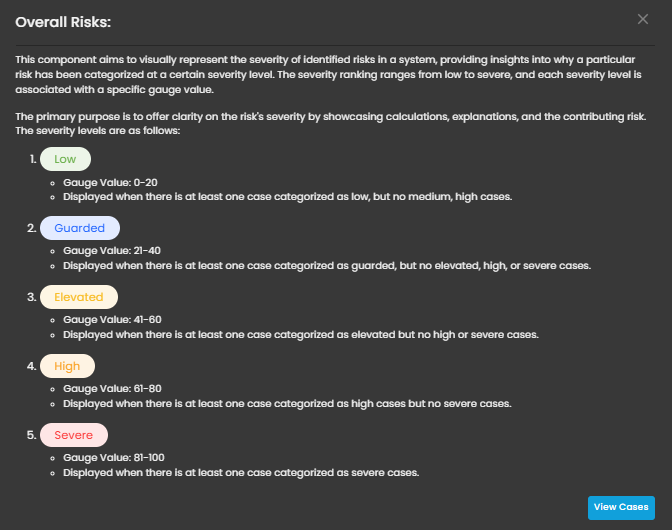
Overall Risk
Displays system risk severity levels on a scale from Low to Severe (0 - 100), explaining the rationale behind risk classifications and showing the highest severity level present in the system. Clicking on the gauge allows you to view more details about
Open Cases
Displays the total number of open cyber incident cases, categorized by severity, that are currently being investigated.
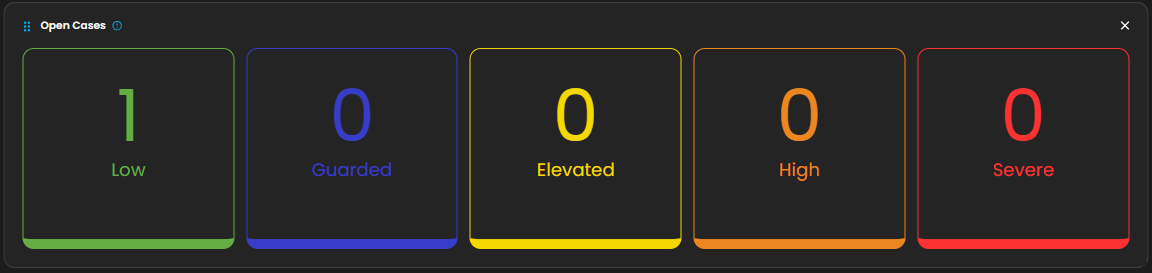
When you click on a category, you will see all the cases that fall under that severity level. For example, as shown in the image above, selecting the “Low Severity” category will display all cases labeled as low severity.
Cases Assigned to Me
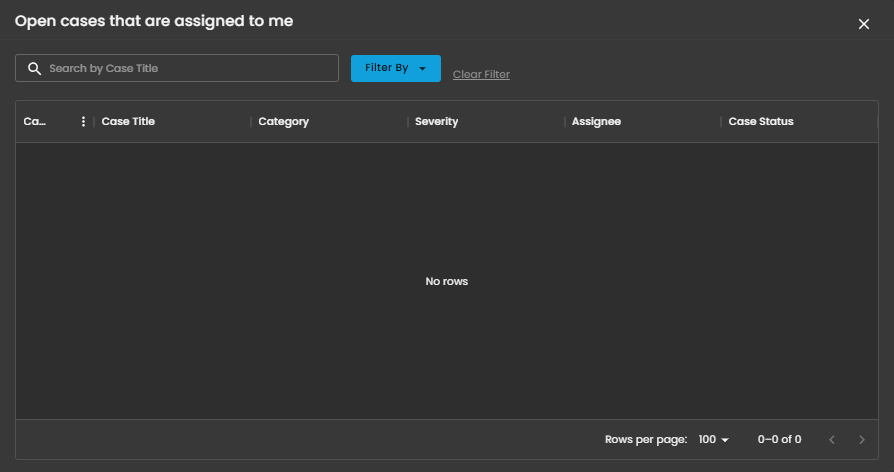
Shows the number of cyber incident cases specifically assigned to you for investigation and resolution. Clicking on it will open up a small window that will show all the cases assigned under you.
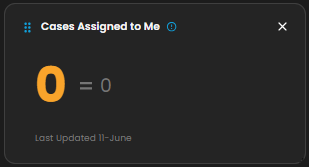
When you click on it, a small window will appear displaying all the cases assigned to you.
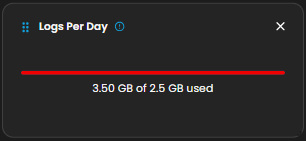
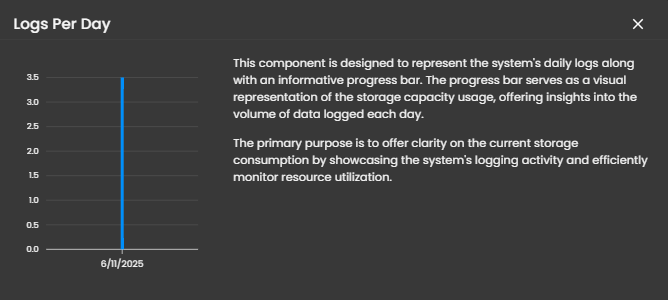
Logs Per Day
Displays daily system logs with a progress bar that tracks storage capacity usage, providing clear insights into daily logging volume and resource consumption.
Log Collector Status
Alerts
Log Rate