
Cyber Incident Management Module
Overview:
Cyber Incident Management with Extended Detection and Response (XDR) and Managed Detection and Response (MDR) provides comprehensive protection against cyber threats by continuously monitoring and analyzing an organization’s digital environment. XDR integrates data from various security sources, such as endpoints, networks, and cloud environments, to detect and correlate threats more effectively. MDR offers 24/7 monitoring, management, and incident response through a third-party service provider. Together, these tools enable rapid identification and mitigation of potential threats, helping to reduce the impact of cyber incidents and ensure the security of organizational assets.
Navigate to Dashboard:
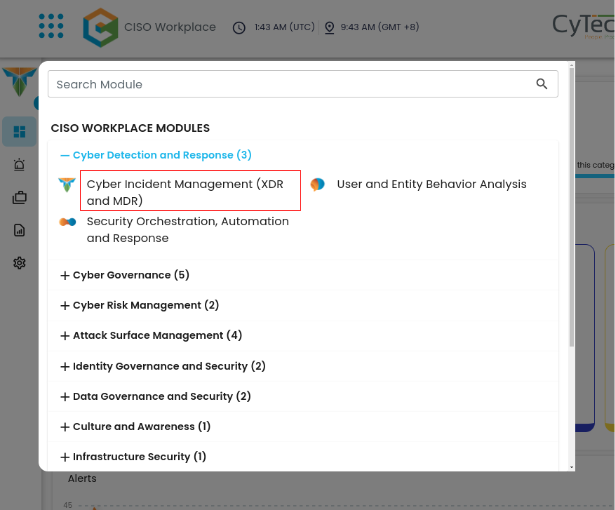
- To show all the different modules, click on the menu icon
 .
.
- Under Cyber Detection and Response, click on Cyber Incident Management (XDR and MDR)
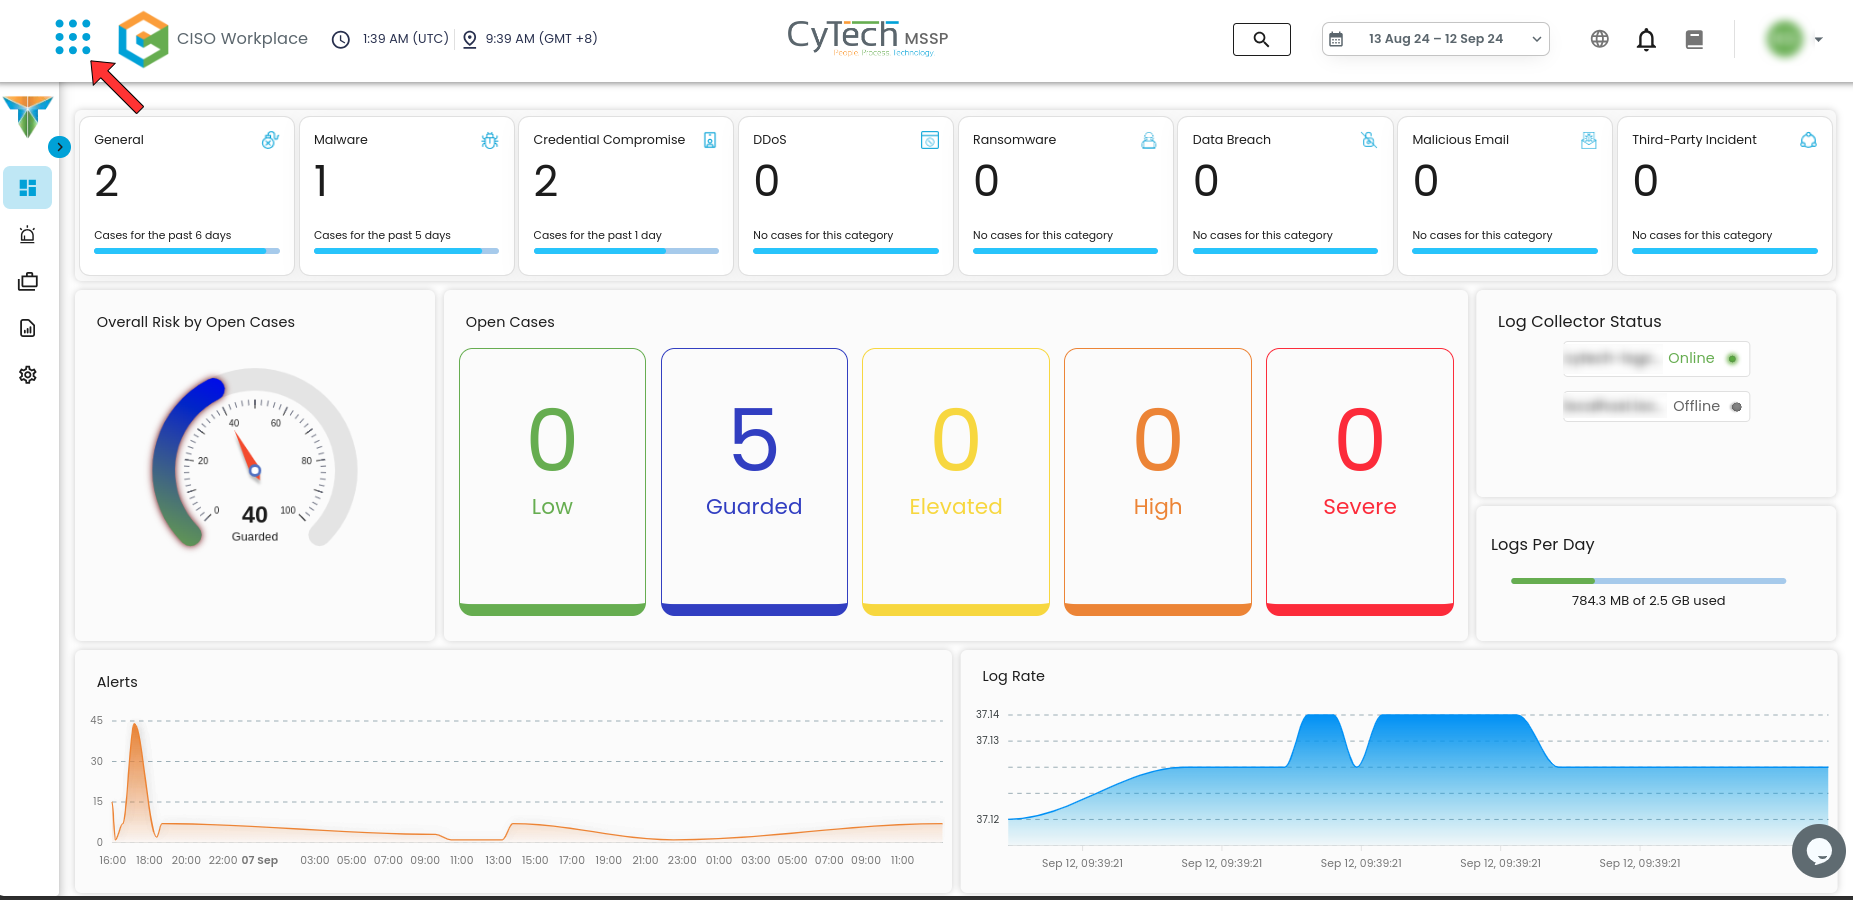
Cyber Incident Management Dashboard:

Alerts Profile:Dashboard:
To access the Alerts Profile page, click the icon on where the red arrow is located
Alerts Dashboard is a tool that provides real-time security alerts and notifications. It provides a unified view of different types of alerts, categorizing them by severity and type, and displays critical details such as the source of the alert, affected assets, and relevant information. This dashboard enables security teams to quickly assess, prioritize, and respond to potential threats by offering comprehensive insights and plays a crucial role in enhancing situational awareness and streamlining the incident response process.
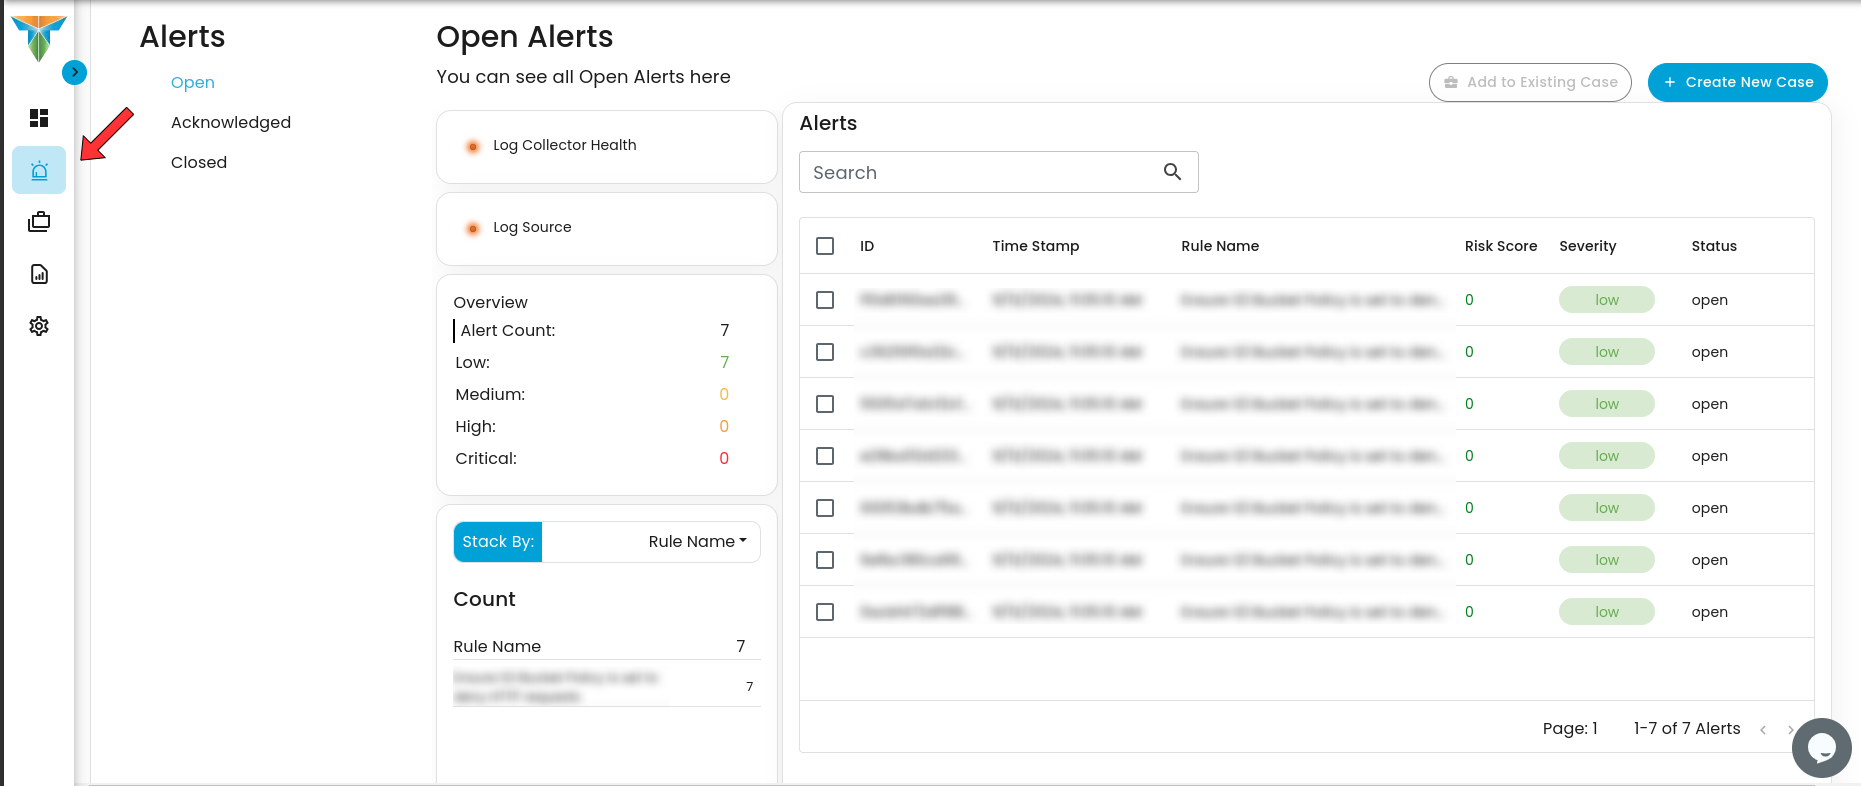
- Alerts Status Types:
- Open Alerts: Alerts awaiting assignment to an analyst for further investigation.
- Acknowledged Alerts: Alerts currently in progress and assigned to an analyst for resolution.
- Closed Alerts: Alerts that have been successfully resolved and closed.
Ways to Create a Case:
Case Creation involves initiating a new incident case when a security alert is detected. This process includes documenting key details about the alert, categorizing and prioritizing the case based on its severity and impact, and tracking all investigation and response activities. By creating a case, security teams can organize and manage the incident comprehensively, ensuring that all related actions and communications are centralized, which facilitates effective resolution and improves overall incident handling.
To Create a case, you can opt to choose either to create a case from the Alerts Dashboard or the Case Management Dashboard
Create a Case in the Alerts Page:
To create a case:
- Select an alert
- Click the create new case button as shown below
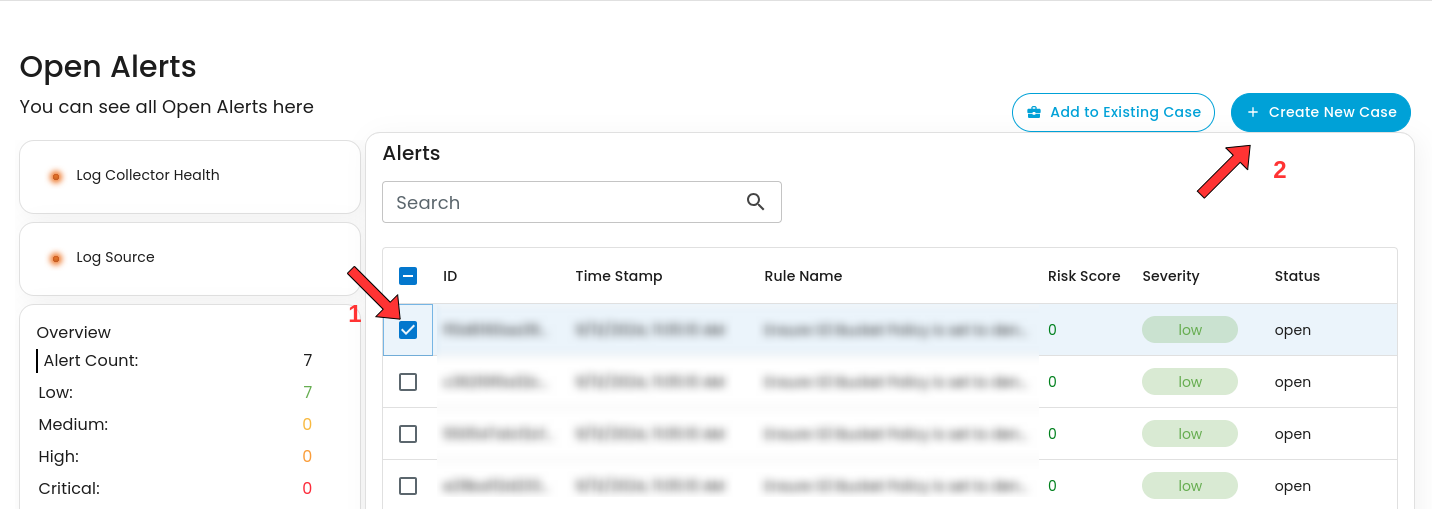
- Doing so will show a modal where information is required to create a case for investigation


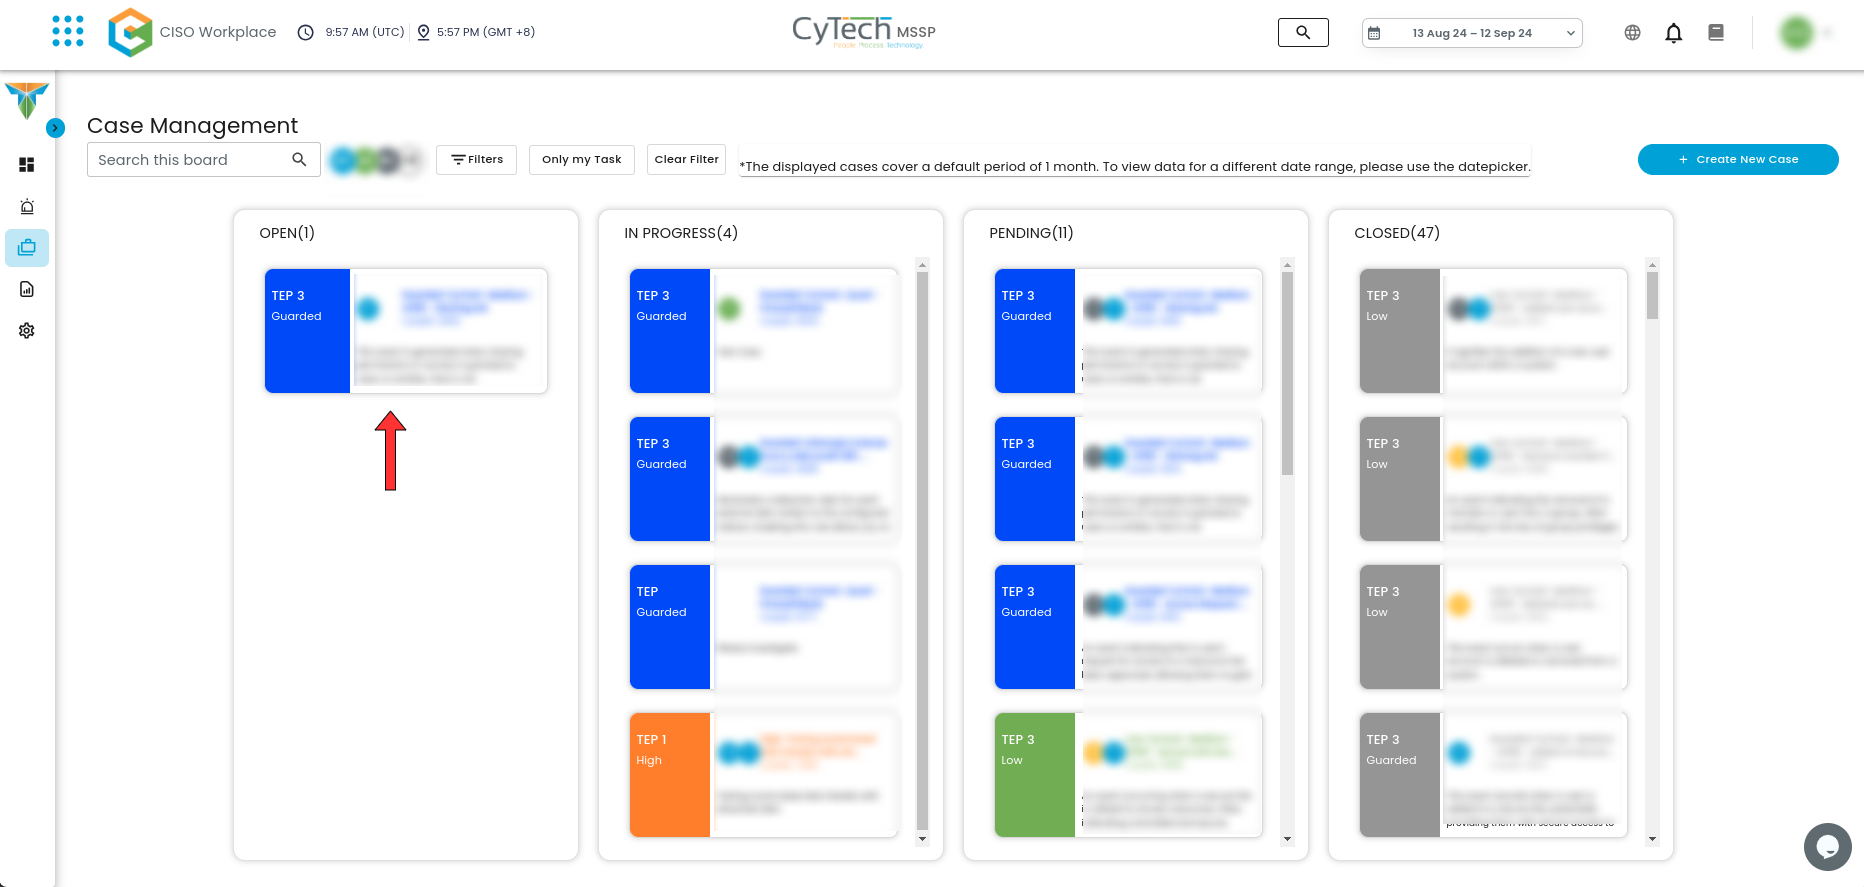
- Once a case has been successfully created, it will show in the Case Management Dashboard as shown below.
Create a Case in the Case Management Page:
To create a case, click on the icon where the red arrow is pointing
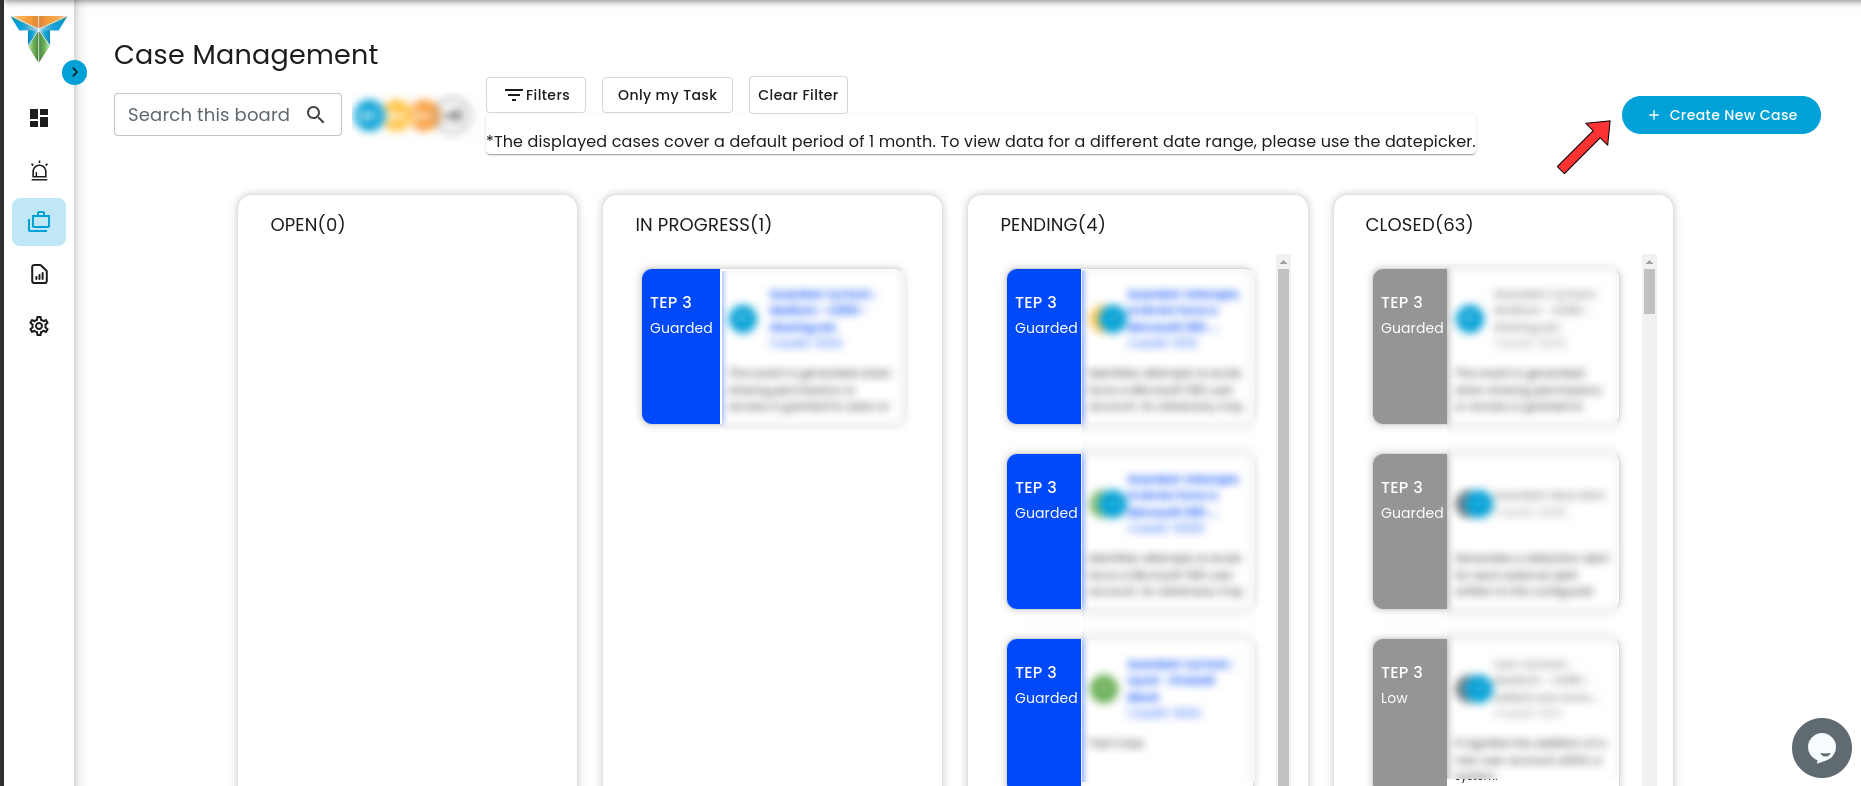
- Doing so will show a modal where information is required to create a case for investigation
Once the necessary information has been added, click submit and a case has been successfully created and will be shown on the Case Management Dashboard as shown below.
How to Add an Alert to Existing Case:
This feature allows security teams to associate a new alert with an ongoing or previously created incident case. By adding a new alert to an existing case, teams can streamline their investigation and response efforts, correlate related data, and avoid duplicating efforts.
Steps to take:
1. To add to an existing case, navigate to the Alerts Dashboard
2. Select an alert and click the create new case button as shown below
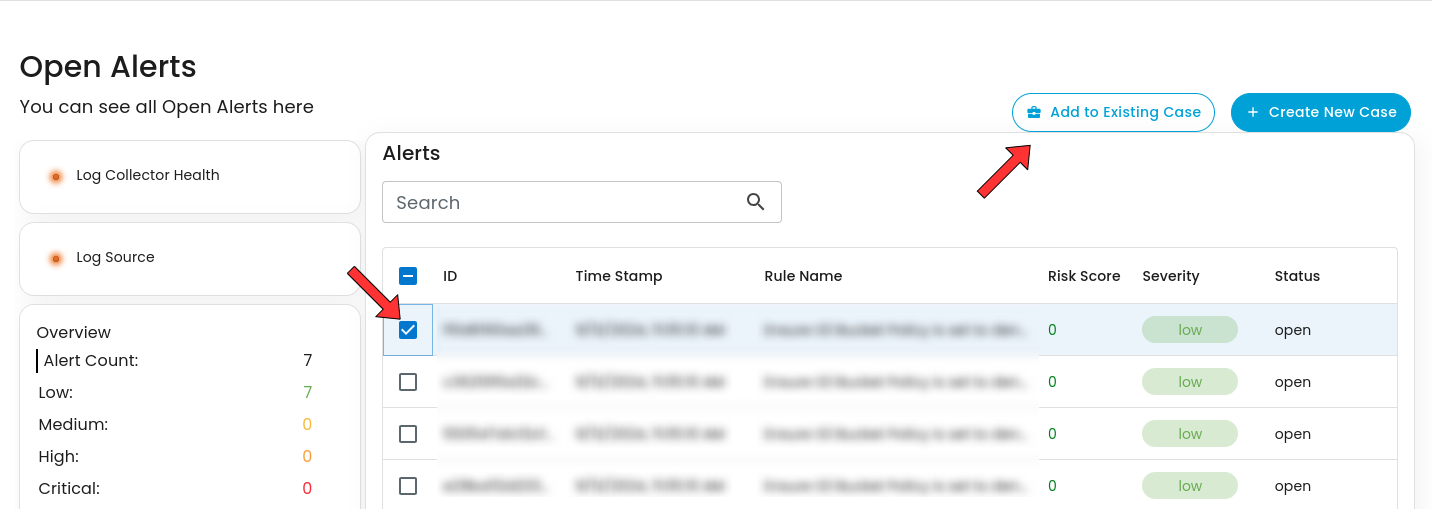
3. Select which existing case is relevant to the alert to add it as an existing case.

Case Management Profile:Dashboard:
To access the Case Management Profile page, click the icon on where the red arrow is located.
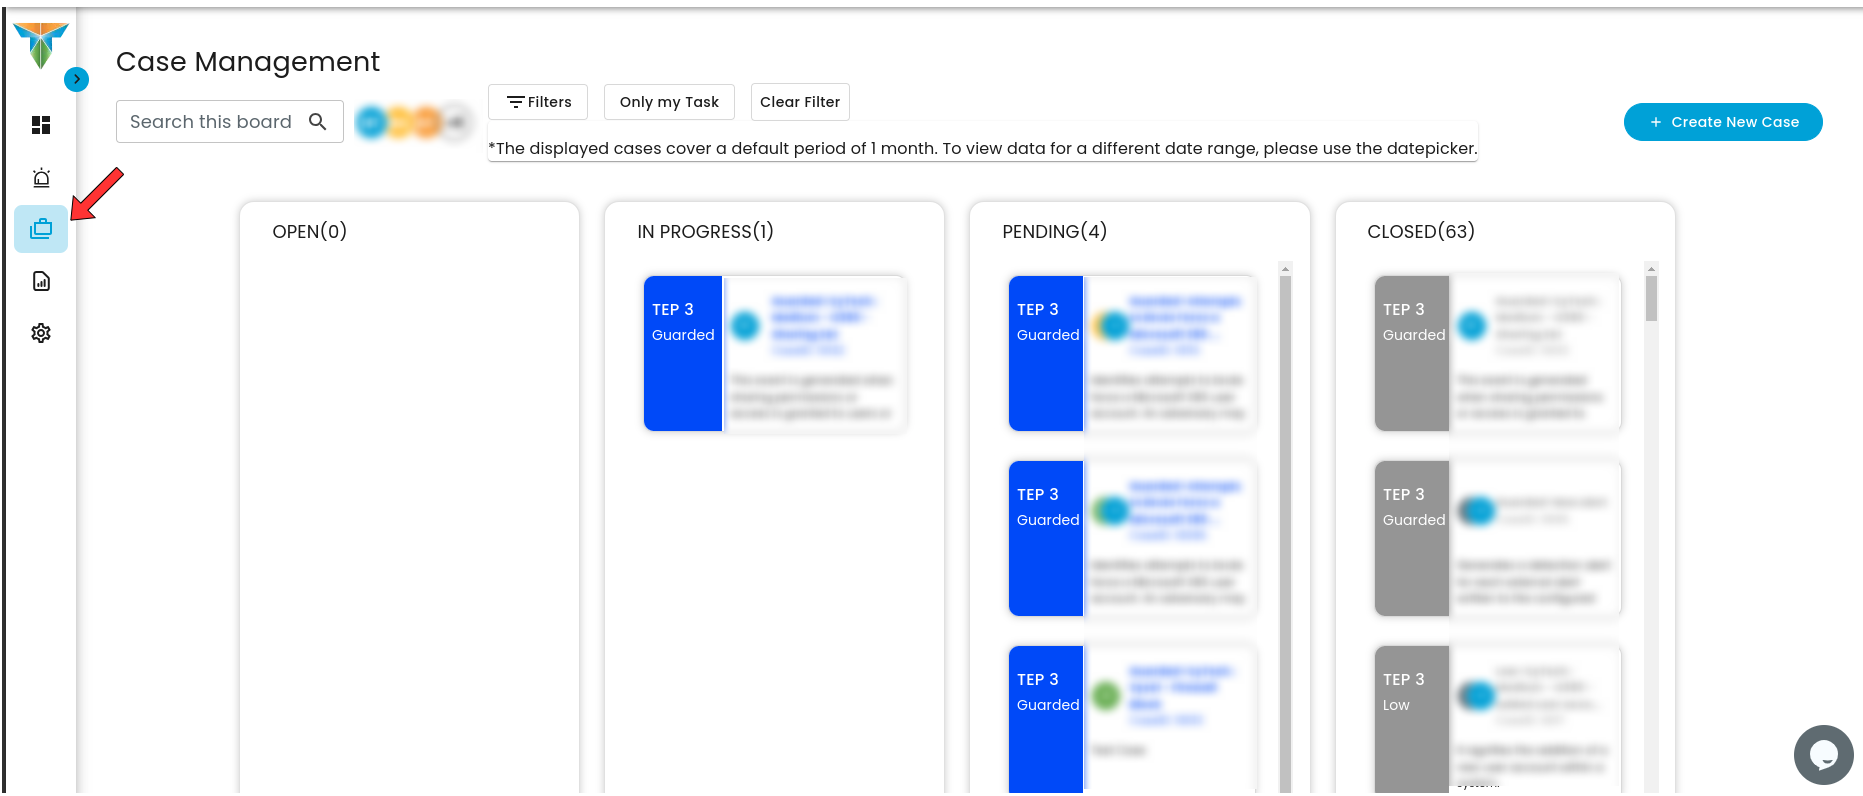
Case Management Dashboard is a tool that provides a comprehensive overview of security incidents. It offers detailed insights into active and past incidents, including their status, severity, and timeline. The dashboard facilitates investigation and response by integrating real-time alerts, threat intelligence, and collaboration features, while also tracking performance metrics and compliance. This centralized approach enhances the efficiency of managing and resolving security incidents, ensuring timely and effective responses to mitigate risks and improve overall security posture.
- Case Status Types:
- Open Cases: Cases awaiting assignment to an analyst for investigation.
- In Progress Cases: Cases currently being worked on by an analyst.
- Pending Cases: Cases awaiting approval from IT head/CISO before further action.
- Closed Cases: Cases that have been resolved and closed.
Moving Case to Pending & Approval:
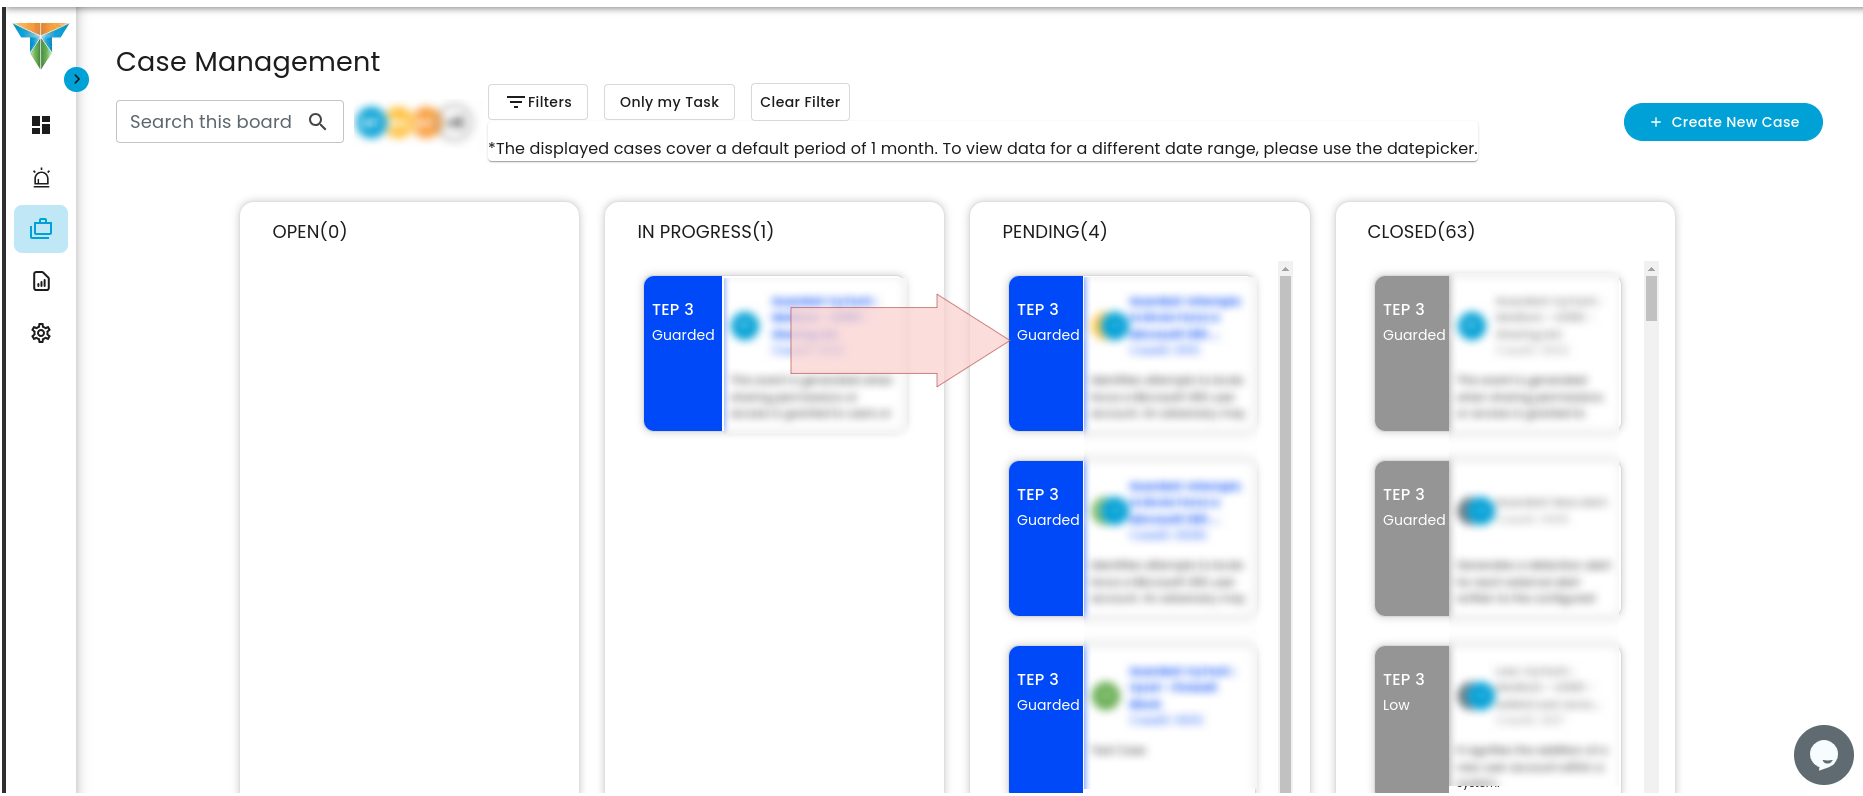
- Move to Pending:
- Select the ticket that requires movement.
- Click and hold the ticket.
- Drag the ticket to the Pending side.
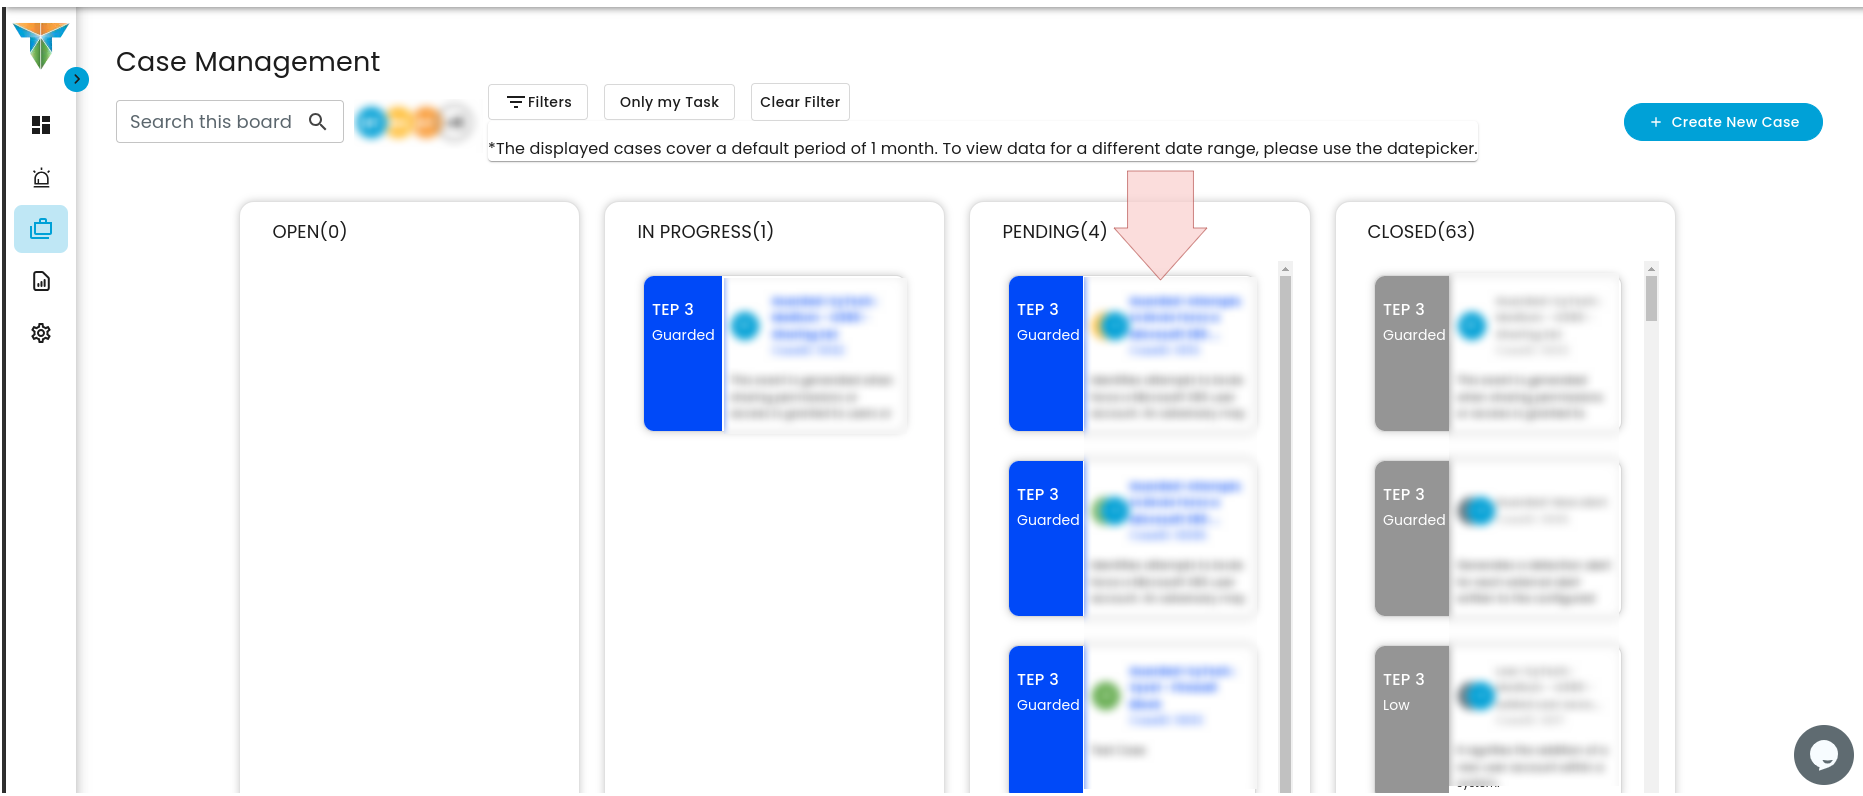
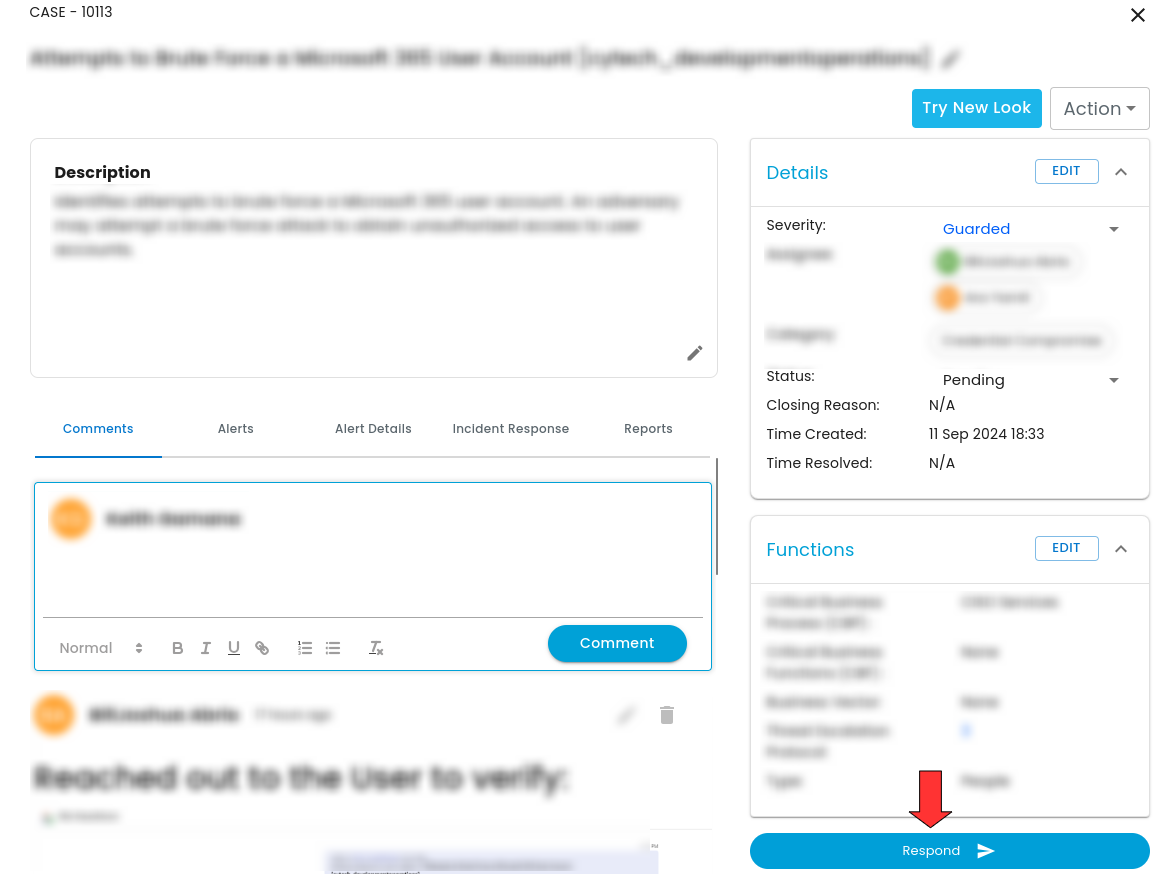
Verification:
- Review the information provided in the modal popup.
- Click on the "Respond" button to proceed.
- Verify the closing reason provided for accuracy.
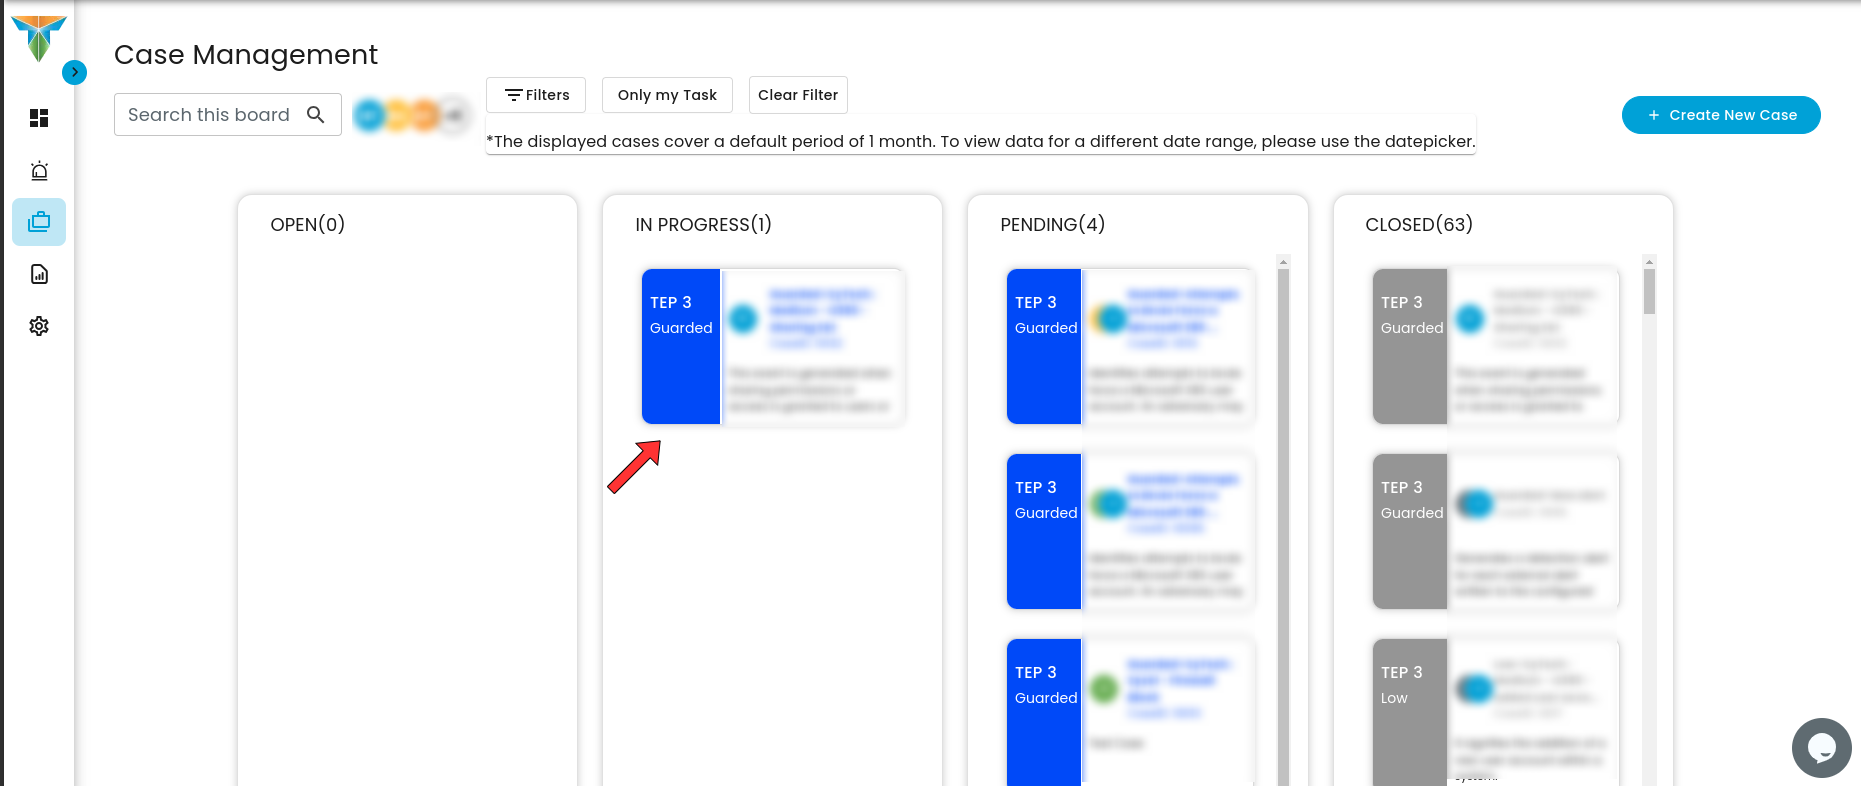
Case Closing:
- Enter the closing reason in the designated field.
- Confirm the closing reason to finalize the process.
- The case/ticket will be moved to closed cases upon confirmation.


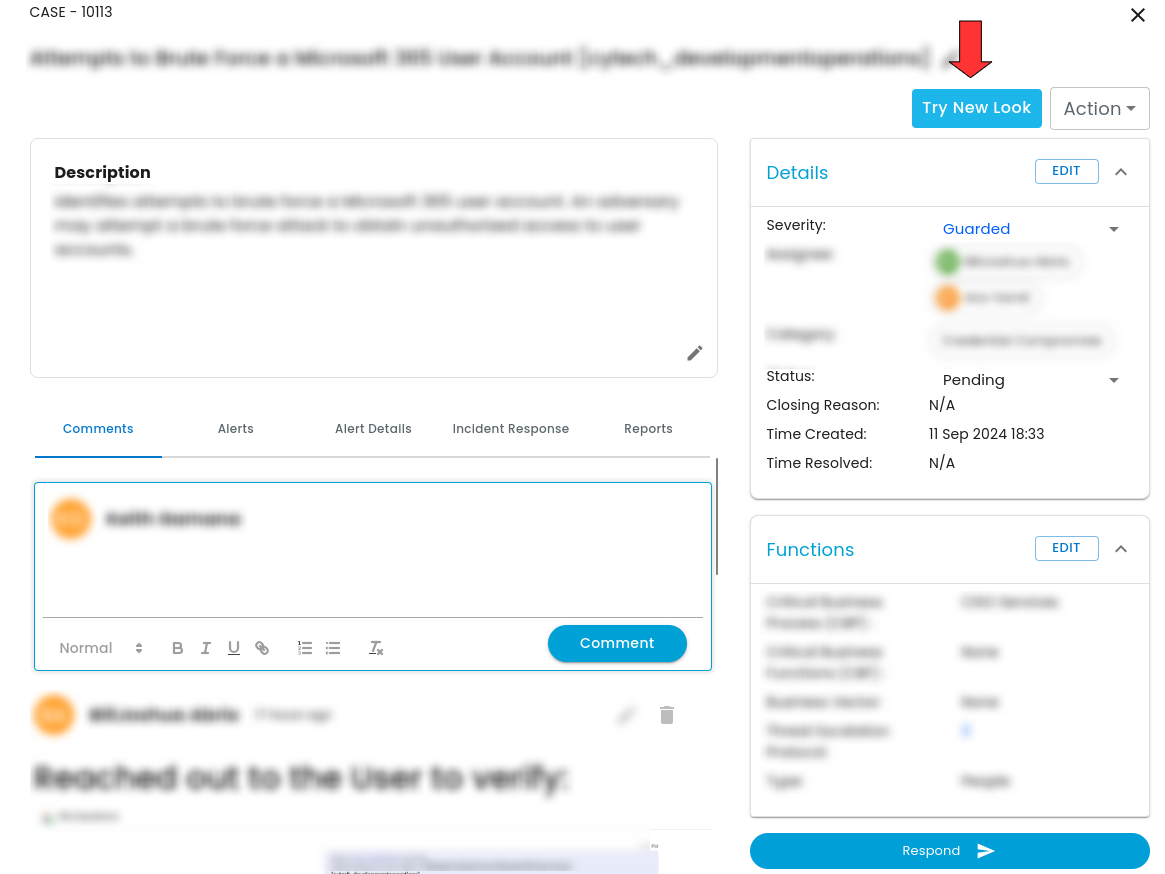
Investigate a Case:
To investigate a case, click on any case available.
Click on 'Try New Look' to access more details regarding the case for a proper investigation.
Key Tools and Features for Effective Case Investigation and Analysis:
Case Playbook:
A Case Playbook in a case investigation is a structured guide that outlines specific procedures and best practices for responding to different types of security incidents. It includes steps for detection, containment, and resolution, defines roles and responsibilities, lists necessary tools, and sets communication and escalation protocols. This standardized approach ensures a consistent, efficient, and thorough response to incidents, facilitating effective management and resolution.

Alerts:
To view details on an alert, click on the list of alerts related to the case on the left. Once clicked, this provides details about the case as well as provides a timeline on when the alert happened.

This table provides all the essential information required to thoroughly investigate a case. It includes details such as the target of the alert, the affected files, and key metadata that helps analysts understand the nature of the incident. By offering comprehensive and actionable data, the table ensures that analysts have the necessary context to conduct an in-depth investigation and take appropriate actions to resolve the issue effectively.

Case Reports:

In the Reports View, this is where all findings from the case investigation are documented. Ensure that all relevant information is accurately filled out to provide a comprehensive overview of the case. This includes a clear explanation of the incident, details on how it was discovered, the impact on the system, and any affected assets. Additionally, outline the steps taken during the investigation, mitigation actions performed, and any recommendations for future prevention. The report should also include any references to related alerts, timelines, and potential vulnerabilities identified. This thorough documentation will serve as the final record for the case, ensuring that all stakeholders are fully informed and that the case is properly closed with actionable insights for ongoing security improvements.
Incident Response:

In the Incident Response View, it involves quickly detecting the incident, assessing its severity, and taking immediate steps to contain and mitigate its impact. This helps teams track the progress of response actions, such as isolating affected systems, neutralizing threats, and restoring normal operations. It also provides visibility into the status of ongoing investigations and any further steps required to fully resolve the incident.
Reports:Reports Dashboard:
To access the reports view, click on the icon where the red arrow is located.
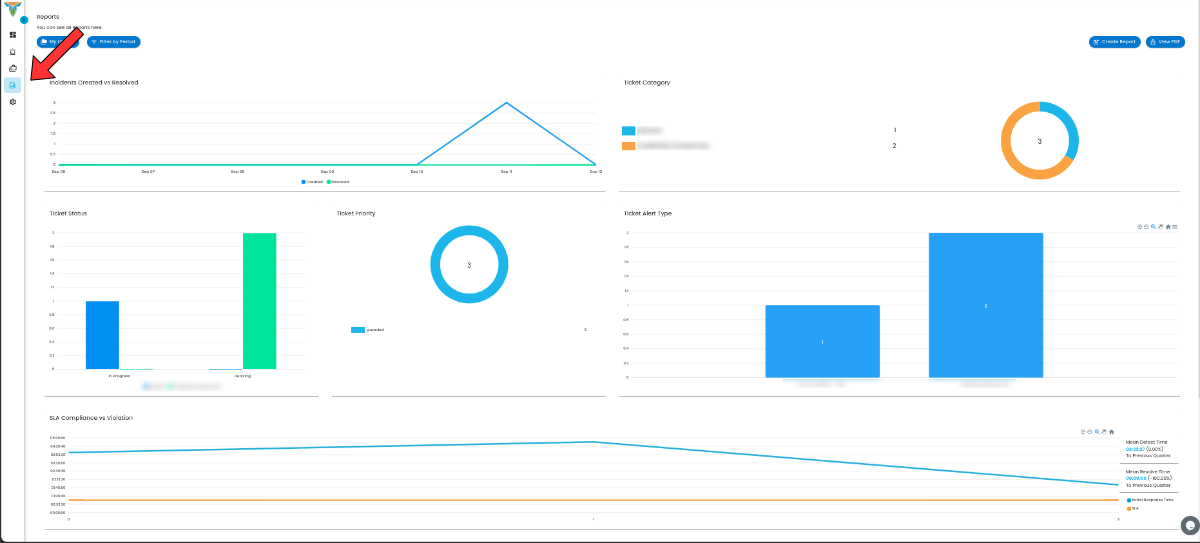
The Reports View for Cyber Incident Management (CIM), charts and metadata play a crucial role in visualizing and summarizing the data related to cases and alerts. The charts offer a graphical representation of incident trends, showing metrics like the number of alerts over time, the severity of cases, and the categories of threats encountered. These visual elements help analysts quickly grasp the overall security posture and identify patterns in incidents. The metadata, such as timestamps, affected systems, and alert details, provides context and deeper insights into each case, allowing for more efficient analysis and decision-making. Together, these tools offer a comprehensive view of incidents and alerts, aiding in both detailed investigation and high-level reporting.
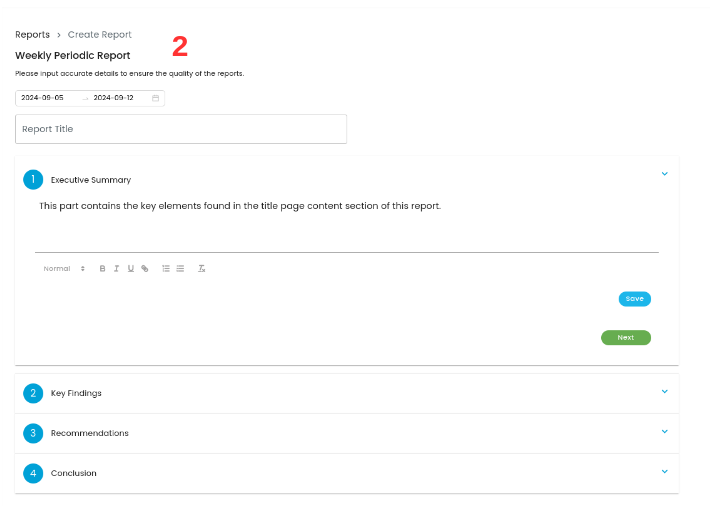
How to Create a Report:

- To create a report, click on the Create Report button and select the time period for which the report will be generated, such as weekly, monthly, quarterly, or annually.
- After choosing the desired time frame, you will be prompted to fill in all necessary information related to the report, including executive summary, key findings, recommendations, and conclusion.
This process ensures that the report covers the relevant time period and contains all critical data for effective review and analysis, as demonstrated in the example below.
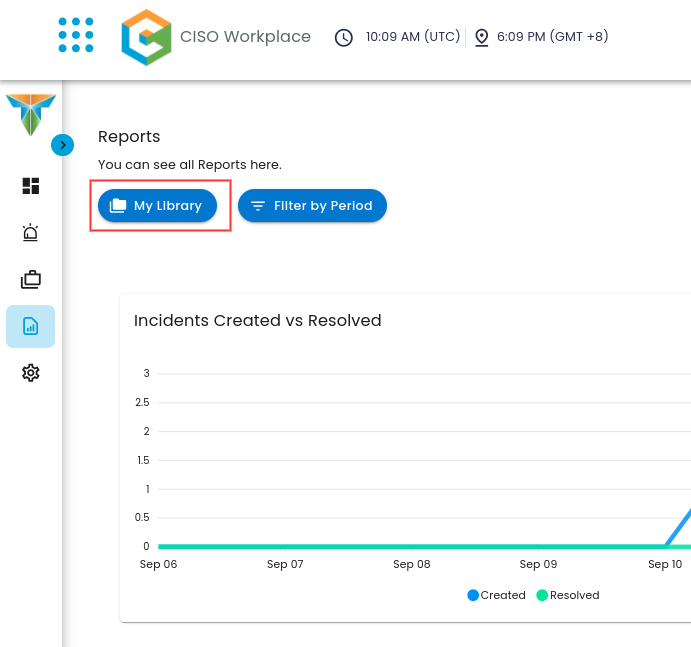
Once a report is generated, it will be saved and readily accessible in the My Library section of the Reports page.
Settings:
To access the settings view, click on the icon where the red arrow is located.
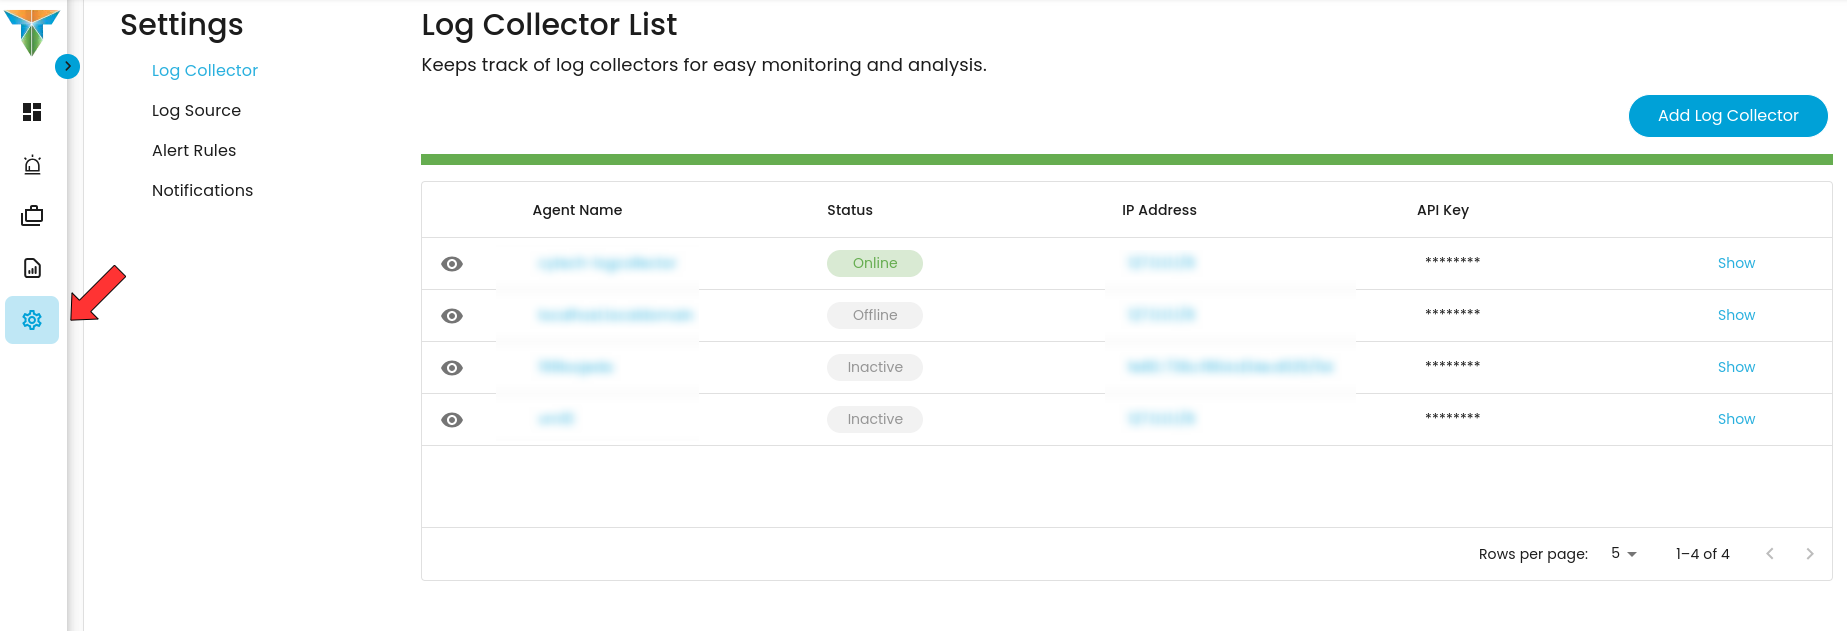
In this view, you can configure and manage various system settings essential for the proper functioning of the monitoring platform. These settings include options to add and manage the log collector list, define and update log sources, configure alert rules for customized threat detection, and set up notifications to ensure timely alerts for critical events. This view allows administrators to tailor the platform to specific operational needs, optimizing data collection, threat detection, and response workflows.
If you need further assistance, kindly contact our support at info@cytechint.com for prompt assistance and guidance.