Cyber Monitoring
Effective security demands vigilance. Continuous monitoring strengthens cyber resilience by enabling proactive threat detection and rapid response. With Cyber Incident Management, organizations can streamline incident handling and reduce exposure time. Cloud Security Posture Management maintains visibility across dynamic cloud environments, identifying misconfigurations and policy violations. Endpoint Detection and Response delivers deep insights into device-level activities, enabling swift containment of malicious behavior. By integrating Security Orchestration, Automation and Response, teams can standardize workflows and accelerate reaction times. User and Entity Behavior Analysis highlights anomalies that signal insider threats or compromised accounts, while Threat Intelligence contextualizes risks with real-world data, enriching decisions with timely insights. Together, these modules form a cohesive defense fabric that detects, responds, and adapts in real time.
- Cyber Monitoring Dashboard
- Cyber Incident Management (SIEM and XDR)
- Cloud Security Posture Management CSPM
- Cyber Incident Management Module
Cyber Monitoring Dashboard
Navigation to Cyber Monitoring Dashboard
To navigate your way to the Cyber Monitoring Dashboard, you must click the redirect icon ![]() beside the "Cyber Monitoring" title.
beside the "Cyber Monitoring" title.

This will then redirect you to the dashboard as seen below.
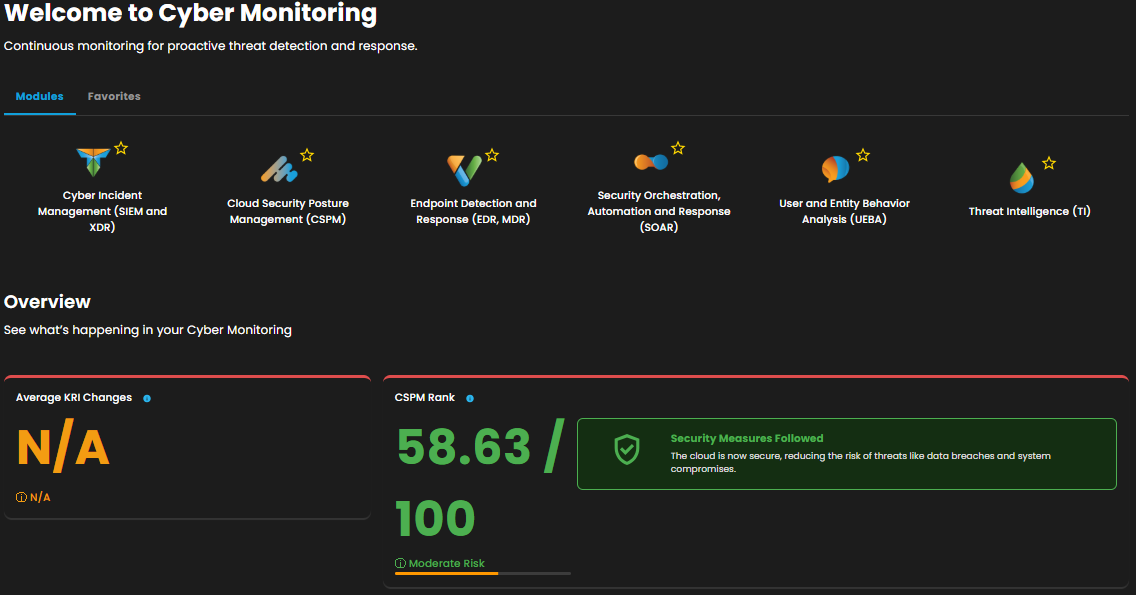 Here you will see the 6 modules:
- Cyber Incident Management (SIEM and XDR)
- Cloud Security Posture Management (CSPM)
- Endpoint Detection and Response (EDR, MDR)
- Security Orchestration, Automation and Response (SOAR)
- User and Entity Behavior Analysis (UEBA)
- Threat Intelligence (TI)
By clicking on their icons, you will be redirected to the modules' "Main Page" section.
Below the modules, you will find the overview.
Average Key Risk Indicator (KRI) Changes
Understanding the volume of digital assets within your environment is fundamental to managing cyber risk. The total number of assets reflects the scale of your digital footprint and highlights potential vectors for exploitation. By quantifying these assets, organizations gain clarity on how broad their exposure surface truly is. This visibility allows teams to prioritize defenses, allocate resources effectively, and reduce blind spots. Recognizing the scope of what’s connected is the first step toward controlling it.

CSPM Rank
Understanding the state of your cloud security is critical. The Cloud Security Posture Management (CSPM) score provides a quantifiable snapshot of how securely your cloud environments are configured. It reflects alignment with established best practices and recognized security standards, offering a clear benchmark for posture maturity. By highlighting deviations, gaps, or misconfigurations, the score empowers teams to prioritize remediation efforts based on risk impact. This metric doesn’t just inform—it drives accountability and continuous improvement, giving organizations the visibility needed to evolve with confidence in an ever-changing threat landscape.

Cases
This section provides a comprehensive overview of your active and historical cases. It is designed to assist you in quickly assessing the status and urgency of each case, enabling effective prioritization and informed decision-making.
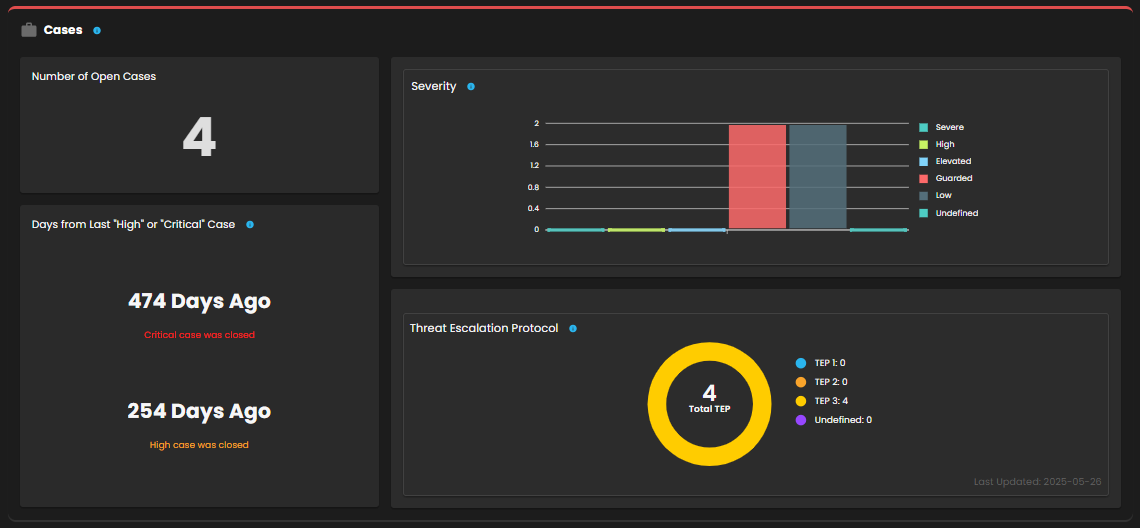
This metric displays the number of days elapsed since the most recent detection of high or critical-level monitoring alerts. A shorter interval may signal the presence of ongoing or recently emerged significant threats.

This section presents a visual breakdown of active cases categorized by severity levels: Severe, High, Elevated, Guarded, and Low. The distribution provides a clear snapshot of the current threat landscape and assists in the prioritization of response efforts according to the urgency of each case.

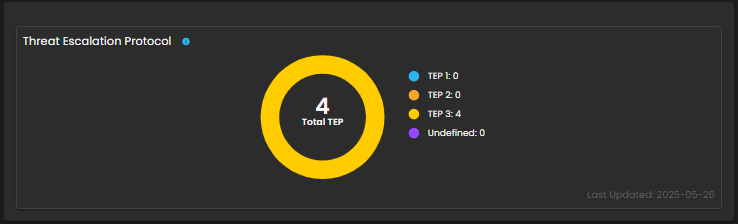
This section displays the cumulative count of open cases categorized by their current stage within the Threat Escalation Protocol (TEP). It provides a clear overview of how individual threats are advancing through the structured escalation process, enabling efficient tracking and management of threat progression.
Log Sources
This section provides a consolidated overview of all configured log sources. Its primary purpose is to assist users in assessing the current log ingestion landscape, enabling effective prioritization of monitoring, investigation, and resource allocation efforts.

This section presents the total count of endpoints currently managed by Endpoint Detection and Response (EDR) agents. It also provides a real-time status breakdown, indicating how many endpoints are online and how many are offline.

This section presents the distribution of collected log data categorized by individual source. It serves as a valuable reference for identifying the most active log-generating systems. Understanding this distribution is essential for optimizing data flow, resource allocation, and maintaining efficient log management practices.

This shows the total volume of logs collected daily, measured against allocate capacity. Helps manage storage utilization and detect unusual log activity.

This section displays a comprehensive list of all installed log collectors, along with the agents associated with each log collector.

Cyber Incident Management (SIEM and XDR)
Welcome to the Cyber Incident Management Dashboard module.
The Main Dashboard serves as the central hub for viewing all critical and relevant data associated with this module. It provides a consolidated interface where key metrics, updates, and operational insights are displayed for quick reference and effective monitoring.

Case Categories
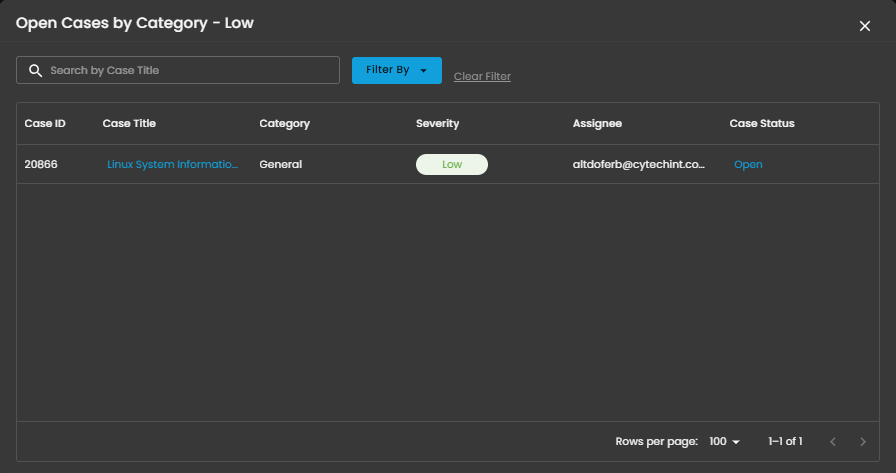
This panel displays and categorizes all cases within your environment that are currently open or in progress. It presents a structured view based on case categories, offering a clear summary of ongoing activity. This allows for efficient tracking, prioritization, and management of active investigations

Upon selecting a category, a new window will automatically open, displaying all cases associated with the selected category.

- Search Bar: The search bar enables users to locate a specific case by entering the exact case title. Simply type the desired title into the search field to quickly retrieve relevant results.
- Filter By & Clear Filter: This feature enables users to refine the list of cases by applying filters based on Severity and Case Status. Use the Filter By option to display only the cases that match specific criteria. To remove all applied filters and return to the full list of cases, use the Clear Filter option.


- Case Details: To access the investigation section of a case, double-click on the case entry. This action will automatically redirect you to the detailed investigation interface for further analysis and review.


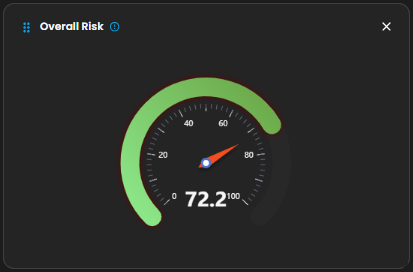
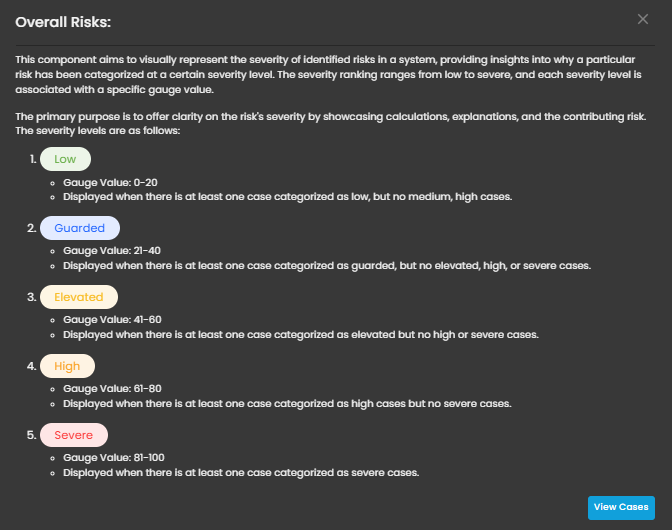
Overall Risk
Displays system risk severity levels on a scale from Low to Severe (0 - 100), explaining the rationale behind risk classifications and showing the highest severity level present in the system. Clicking on the gauge allows you to view more details about
Open Cases
Displays the total number of open cyber incident cases, categorized by severity, that are currently being investigated.
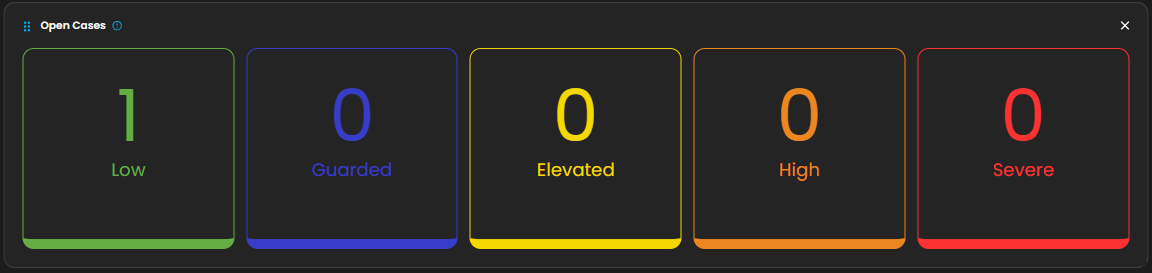
When you click on a category, you will see all the cases that fall under that severity level. For example, as shown in the image above, selecting the “Low Severity” category will display all cases labeled as low severity.
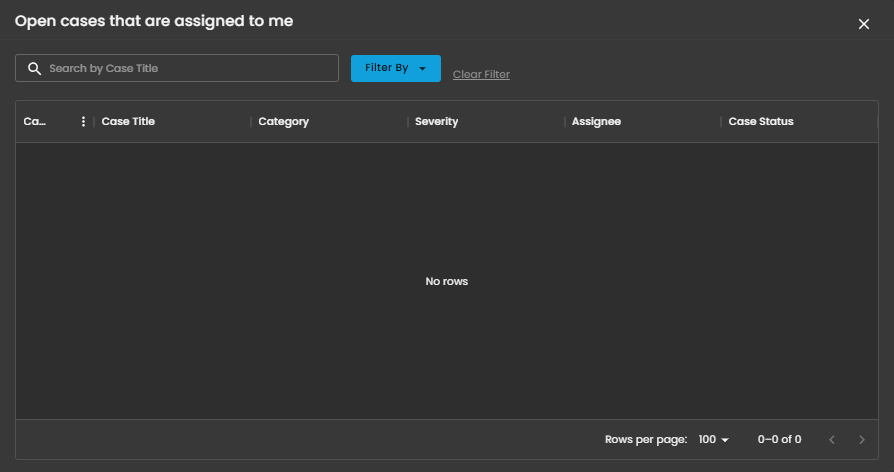
Cases Assigned to Me
Shows the number of cyber incident cases specifically assigned to you for investigation and resolution. Clicking on it will open up a small window that will show all the cases assigned under you.
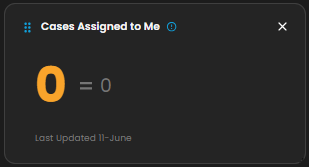
When you click on it, a small window will appear displaying all the cases assigned to you.
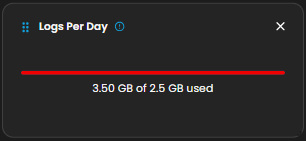
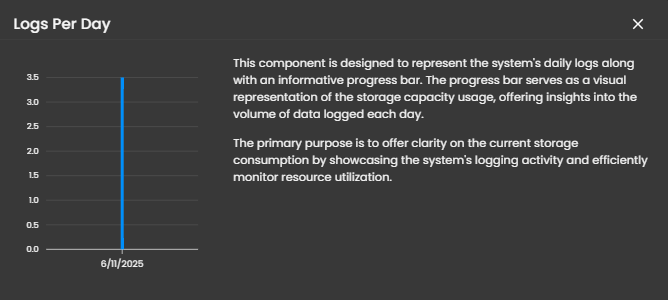
Logs Per Day
Displays daily system logs with a progress bar that tracks storage capacity usage, providing clear insights into daily logging volume and resource consumption.
Log Collector Status
Alerts
Log Rate
Cloud Security Posture Management CSPM
Welcome to the Cloud Security Posture Management CSPM module.
The Cloud Security Posture Dashboard provides a streamlined view of your AWS compliance status. It highlights the overall security posture, identifies areas needing attention, and tracks compliance across key AWS services. This dashboard helps teams quickly assess risk, monitor changes over time, and prioritize remediation efforts. It also offers visibility into recent evaluation results, supporting proactive cloud security management.


ACCOUNTS EVALUATED:
In this section here is the total number of cloud environments that have undergone security assessments.

COMPLIANCE SCORE:
This is the Compliance Score provides an aggregated score reflecting the extent to which your cloud environments comply with configured security policies and standards.
COMPLIANCE BY CIS:
This section displays the percentage compliance status across various security benchmarks defined by CIS (Center of Internet Security)

FINDINGS:
Summarizes the total count of identified security issues or findings within your cloud environments.

POSTURE TRENDS (Graph):
Illustrates the historical trajectory of your security posture changes overtime, aiding in monitoring improvements or potential vulnerabilities. (Due to insufficient data there has yet to be a graph inputted into this as of creating this manual).


POSTURE TRENDS:
Illustrates the historical trajectory of your security posture changes overtime, aiding in monitoring improvements or potential vulnerabilities. ( This is where the graph will get its data from).
Misconfiguration Section in CSPM

Cyber Incident Management Module
Overview:
Cyber Incident Management with Extended Detection and Response (XDR) and Managed Detection and Response (MDR) provides comprehensive protection against cyber threats by continuously monitoring and analyzing an organization’s digital environment. XDR integrates data from various security sources, such as endpoints, networks, and cloud environments, to detect and correlate threats more effectively. MDR offers 24/7 monitoring, management, and incident response. Together, these tools enable rapid identification and mitigation of potential threats, helping to reduce the impact of cyber incidents and ensure the security of organizational assets.
Navigate to Dashboard:
- To show all the different modules, click on the menu icon

- Under Cyber-Monitoring, click on Cyber Incident Management (SIEM and XDR)

Cyber Incident Management Dashboard:

Alerts Dashboard:
To access the Alerts Profile dashboard, click the icon on where the black arrow is pointed.

Upon clicking the Collapse Button, the sidebar will be displayed, showing the "Alert" tab.

After clicking "Alerts," all generated alerts will be displayed.

Alerts Dashboard is a tool that provides real-time security alerts and notifications. It provides a unified view of different types of alerts, categorizing them by severity and type, and displays critical details such as the source of the alert, affected assets, and relevant information. This dashboard enables security teams to quickly assess, prioritize, and respond to potential threats by offering comprehensive insights and plays a crucial role in enhancing situational awareness and streamlining the incident response process.
- Alerts Status Types:
- Open Alerts: Alerts awaiting assignment to an analyst for further investigation.
- Acknowledged Alerts: Alerts currently in progress and assigned to an analyst for resolution.
- Closed Alerts: Alerts that have been successfully resolved and closed.
Ways to Create a Case:
Case Creation involves initiating a new incident case when a security alert is detected. This process includes documenting key details about the alert, categorizing and prioritizing the case based on its severity and impact, and tracking all investigation and response activities. By creating a case, security teams can organize and manage the incident comprehensively, ensuring that all related actions and communications are centralized, which facilitates effective resolution and improves overall incident handling.
To create a case, you can opt to choose either to create a case from the Alerts Dashboard or the Case Management Dashboard
Create a Case in the Alerts Dashboard:
To create a case:
- Select an alert
- Click the create new case button as shown below

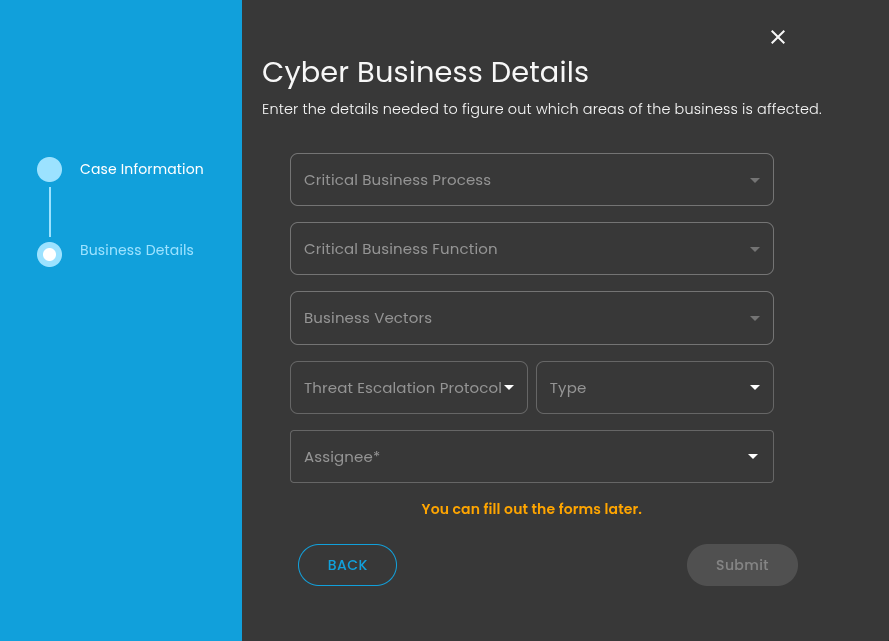
- Doing so will show a modal where information is required to create a case for investigation

- Once a case has been successfully created, it will show in the Case Management Dashboard as shown below.


Create a Case in the Case Management Dashboard:
To create a case, click on the icon where the red box is located
- Doing so will show a modal where information is required to create a case for investigation
- Once the necessary information has been added, click submit and a case has been successfully created and will be shown on the Case Management Dashboard as shown below.

How to Add an Alert to an Existing Case:
This feature allows security teams to associate a new alert with an ongoing or previously created incident case. By adding a new alert to an existing case, teams can streamline their investigation and response efforts, correlate related data, and avoid duplicating efforts.
Steps to take:
1. To add to an existing case, navigate to the Alerts Dashboard
2. Select an alert and click the add to existing case button as shown below

3. Select which existing case is relevant to the alert to add it as an existing case.

Case Management Dashboard:
To access the Case Management Profile Dashboard, click the icon on where the black arrow is pointed.

Upon clicking the Collapse Button, the sidebar will be displayed, showing the "Cases" tab.

After clicking "Cases" all generated alerts will be displayed.

Case Management Dashboard is a tool that provides a comprehensive overview of security incidents. It offers detailed insights into active and past incidents, including their status, severity, and timeline. The dashboard facilitates investigation and response by integrating real-time alerts, threat intelligence, and collaboration features, while also tracking performance metrics and compliance. This centralized approach enhances the efficiency of managing and resolving security incidents, ensuring timely and effective responses to mitigate risks and improve overall security posture.
- Case Status Types:
- Tier 1 Cases: Cases awaiting assignment to a Tier 1 analyst for investigation.
- Tier 2 Cases: Cases currently being further investigated by a Tier 2 senior analyst.
- Tier 3 Cases: Cases awaiting approval from Tier 3 before further action.
- Pending Cases: Cases awaiting confirmation on the client.
- Closed Cases: Cases that have been resolved and closed.
How to Investigate a Case:
To start investigating a case, choose an open case as shown below.

- It will then redirect to a new page displaying case-related information, including alerts, alert details, and incident response data, all essential for conducting a thorough investigation. For detailed information, refer to the Key Tools and Features for Effective Case Investigation and Analysis section of the guide.

- Once a case has been created, the case status will be updated to 'Tier 1. This signals the entire response team that the investigation is active, helping coordinate efforts, prioritize resources, and ensure timely resolution of the incident.


- Once a Tier 1 analyst completes the case investigation and it is moved to Tier 2 for further verification, change the case status to 'Tier 2.' This status update is necessary as it indicates that the investigation phase is concluded, and the case is in a holding state, waiting for final validation. If Tier 2 determines that the case should be escalated to Tier 3 for user confirmation, the status will be updated accordingly. This helps prevent premature closure and ensures that all necessary checks and confirmations are made before finalizing the case.

- In this section, if Tier 2 determines that the case should be escalated to Tier 3 for user confirmation, the status will be updated accordingly and changed to 'Pending'.


- Once the end user's confirmation is received and the case investigation is complete, change the case status to 'Closing.' This status update signifies that the case is in the final stages of resolution and is pending closure, ensuring that all required actions have been taken and the case is ready for final documentation and closure.


This will display a modal where you need to enter the required information for closing the case. Once you have completed the necessary fields and provided closing remarks, the case can then be successfully finalized and closed.

The closed case will then be shown in the closed case section of the Case Management Dashboard

Drag Feature for the Case Management Dashboard:
Instead of using traditional methods to update case statuses through predefined options, users can now manually drag cases to indicate their current stage: Tier 1, Tier 2, Tier 3, Pending, or Closed. It is important to follow the correct sequence moving from Tier 1 to Tier 2, then to Tier 3, and to Pending, and finally to Closed. When marking a case as Closed, ensure that you fill in the required closing remarks to complete the process successfully.

Key Tools and Features for Effective Case Investigation and Analysis:
Case Playbook:
A Case Playbook in a case investigation is a structured guide that outlines specific procedures and best practices for responding to different types of security incidents. It includes steps for detection, containment, and resolution, defines roles and responsibilities, lists necessary tools, and sets communication and escalation protocols. This standardized approach ensures a consistent, efficient, and thorough response to incidents, facilitating effective management and resolution.

Alerts:
To view details on an alert, click on the list of alerts related to the case on the left. Once clicked, this provides details about the case as well as provides a timeline on when the alert happened.

This table provides all the essential information required to thoroughly investigate a case. It includes details such as the target of the alert, the affected files, and key metadata that helps analysts understand the nature of the incident. By offering comprehensive and actionable data, the table ensures that analysts have the necessary context to conduct an in-depth investigation and take appropriate actions to resolve the issue effectively.

Case Reports:

In the Reports View, this is where all findings from the case investigation are documented. Ensure that all relevant information is accurately filled out to provide a comprehensive overview of the case. This includes a clear explanation of the incident, details on how it was discovered, the impact on the system, and any affected assets. Additionally, outline the steps taken during the investigation, mitigation actions performed, and any recommendations for future prevention. The report should also include any references to related alerts, timelines, and potential vulnerabilities identified. This thorough documentation will serve as the final record for the case, ensuring that all stakeholders are fully informed and that the case is properly closed with actionable insights for ongoing security improvements.
Incident Response:

In the Incident Response View, it involves quickly detecting the incident, assessing its severity, and taking immediate steps to contain and mitigate its impact. This helps teams track the progress of response actions, such as isolating affected systems, neutralizing threats, and restoring normal operations. It also provides visibility into the status of ongoing investigations and any further steps required to fully resolve the incident.
Reports Dashboard:
To access the report view, click on the icon where the black arrow is located.

The Reports View for Cyber Incident Management (CIM), charts and metadata play a crucial role in visualizing and summarizing the data related to cases and alerts. The charts offer a graphical representation of incident trends, showing metrics like the number of alerts over time, the severity of cases, and the categories of threats encountered. These visual elements help analysts quickly grasp the overall security posture and identify patterns in incidents. The metadata, such as timestamps, affected systems, and alert details, provides context and deeper insights into each case, allowing for more efficient analysis and decision-making. Together, these tools offer a comprehensive view of incidents and alerts, aiding in both detailed investigation and high-level reporting.
How to Create a Report:

- To create a report, click on the Create Report button, input the report title and select the time period for which the report will be generated, such as weekly, monthly, quarterly, or annually.
- After choosing the desired time frame, you will be prompted to fill in all necessary information related to the report, including executive summary, key findings, recommendations, and conclusion.
This process ensures that the report covers the relevant time period and contains all critical data for effective review and analysis, as demonstrated in the example below.

Once a report is generated, it will be saved and readily accessible in the My Library section of the Reports Dashboard.

Settings:
To access the settings view, click on the icon where the black arrow is located.

In this view, you can configure and manage various system settings essential for the proper functioning of the monitoring platform. These settings include options to add and manage the log collector list, define and update log sources, configure alert rules for customized threat detection, and set up notifications to ensure timely alerts for critical events. This view allows administrators to tailor the platform to specific operational needs, optimizing data collection, threat detection, and response workflows.
If you need further assistance, kindly contact our support at support@cytechint.com for prompt assistance and guidance.