Attack Surface Management
Attack Surface Management (ASM) is a cybersecurity practice focused on the continuous discovery, analysis, prioritization, remediation, and monitoring of vulnerabilities and potential attack vectors within an organization’s IT infrastructure.
Threat Intelligence
Overview
This advanced module operates as a virtual threat analyst, continuously gathering, analyzing, and enriching threat data from various sources to provide actionable insights and proactive threat mitigation strategies. It empowers organizations to stay ahead of evolving cyber threats and make informed decisions to safeguard their critical assets.
Key Features:
-
Threat Intelligence Dashboard: The Threat Intelligence Dashboard is a comprehensive tool that offers a visual representation of cyber threats and vulnerabilities. It includes features such as Social Network visualization, Trending, tracks mention of an organization over time and references to top industries in cyber threat reports, providing insights into potential targets. The Scanning feature provides insights into threat actors’ probing activities, while Top Scan Results highlight significant findings from these scans.
-
Social Footprint: Social Footprint measures, manages, and reports an organization’s social sustainability performance. It helps organizations understand their social risks and impacts and communicate their social sustainability efforts effectively.
-
Scan: The Scan feature automates the process of examining a system or network for any behavior or information that might signify a threat or vulnerability.
-
Domain Scan: The Domain Scan tool automates the process of investigating a specific domain for potential threats or vulnerabilities.
-
Feed: The Feed feature in a threat intelligence news feed is a real-time, continuous data stream that gathers information related to cyber risks or threats.
User Manual:
Threat Intelligence Dashboard
Click the “Threat Intelligence Module” to navigate to the TI Dashboard

Threat Intelligence Side Navigation Menu
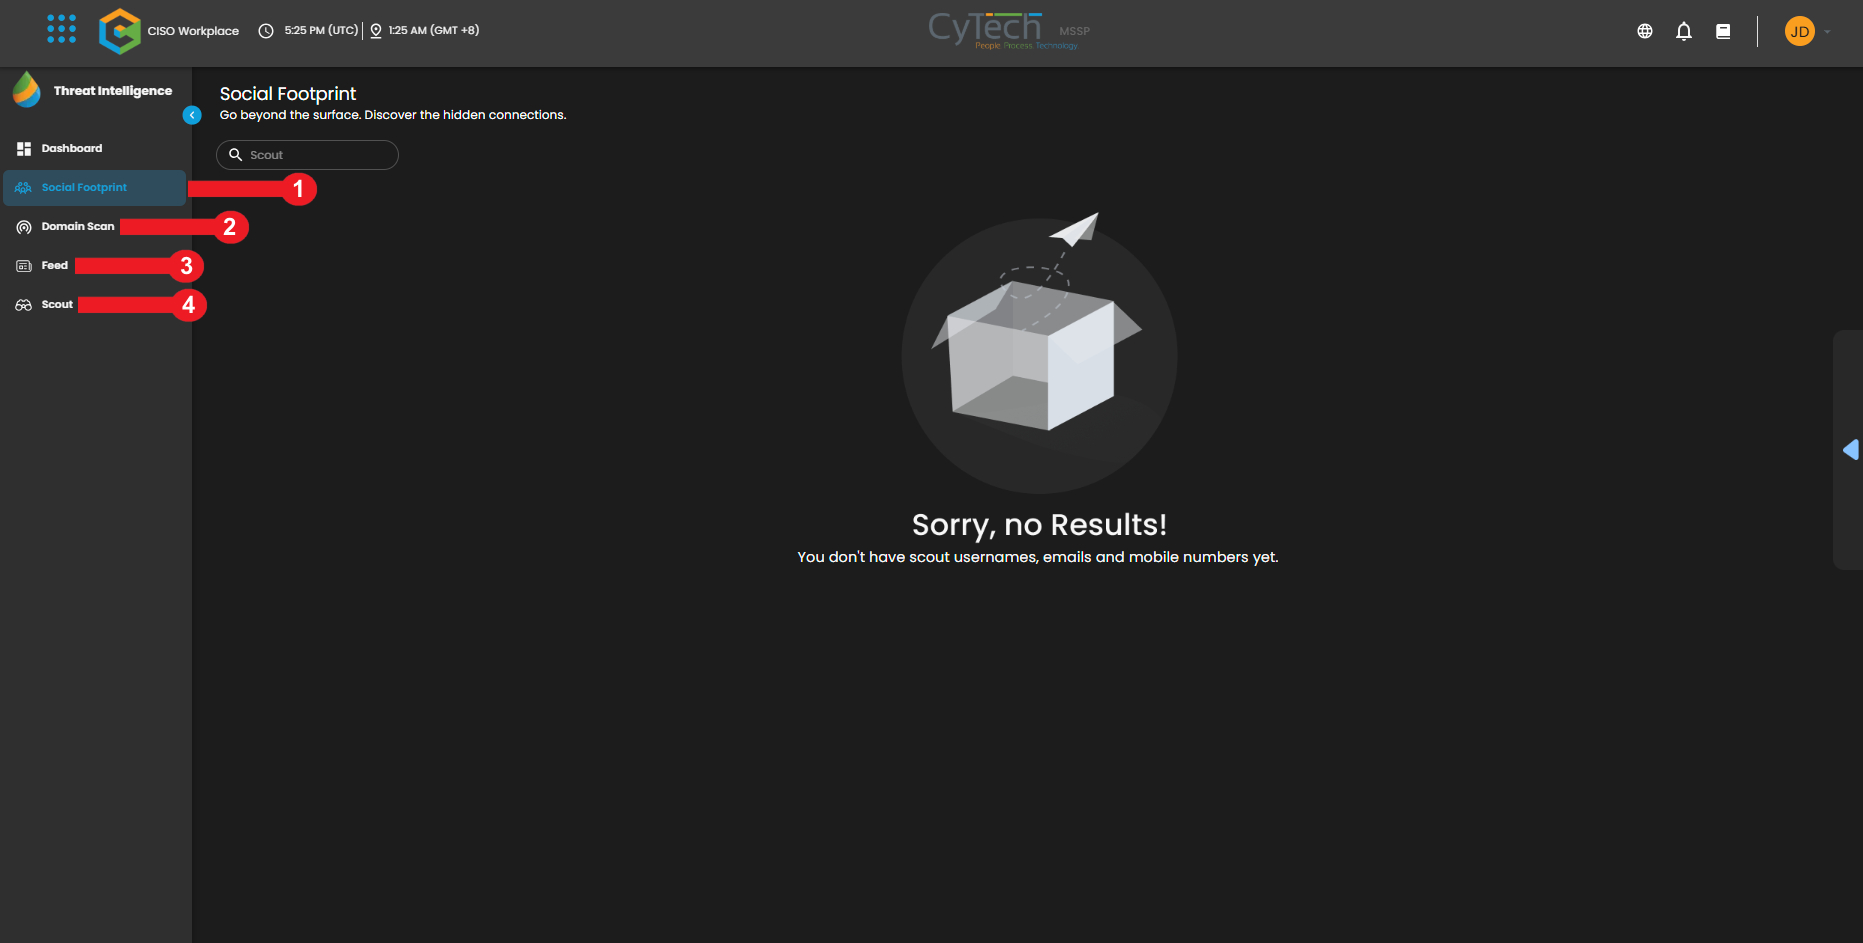
Social Footprint

Domain Scan
Click Domain Scan, then click the New Scan Button. Input the Name of the target and the target domain, then click Scan Now. After the scan, click the scanned target to view the data. Data shown are the result of a scanned domain. Click on one of the correlations to view the vulnerabilities of the hosts.


Target view data

Scanned domain

Host Vulnerabilities view

Feed
Click the Feed, select a cyber news site, and click View More to view the list of news on that site. Select any news to read.
Feel free to adjust the template further as needed!
View more

List of News in Bleeping Computer site.

Select any News

If you need further assistance, kindly contact our support at info@cytechint.com for prompt assistance and guidance.
Vulnerability Assessment and Management
Overview
Welcome to the Vulnerability Assessment and Management module. In this section, you'll be guided through the process of using our vulnerability assessment and management tool. You'll learn how to:
- Access the module interface.
- Create and configure a VAM scan.
- Navigate the dashboard and understand its components.
Vulnerability assessment and management is a process for identifying, evaluating, and addressing security weaknesses in an organization’s systems and networks. It involves scanning for vulnerabilities, assessing their impact, and prioritizing them by severity. This includes using tools and techniques to find vulnerabilities, analyzing the results, and generating reports for remediation. Management then involves applying patches, adjusting security settings, and monitoring for new threats. The goal is to enhance security, reduce risk, and protect against potential exploitation.
Navigate to the module:
- Click on the menu icon to show all the different modules

- Under the Cyber Assessment, click on Vulnerability Assessment and Management (VAM)

How to Create a Scan
- To create a VAM scan you must first go to the scans dashboard as shown in the picture

- Then you click the New Scan button

- A modal then pops up to showcase the types of scans that can be conducted. Once a type is chosen, click next to proceed.

- Input fields are shown to be filled out to start a scan:
- Name - name of the organization
- Description - description of the scan
- Target - link of where the scan will be conducted, i.e www.example.com

- Once the information is filled out, click start scan. The newly created scan will be placed in the scans dashboard.
Scans Dashboard:

The scans dashboard provides a comprehensive overview of all ongoing scans, displaying the percentage of completion for each one. Additionally, it highlights the number of detected severities and vulnerabilities, offering a clear and detailed snapshot of the scan results.
- Clicking on the view button for a completed scan shows a full in-depth analysis on the results of the scan

Vulnerability Assessment and Management Dashboard:
- Offers a comprehensive overview of the organization's risk profile and vulnerabilities.

Vulnerability Score:

The total risk presented by vulnerabilities found in an organization's systems is measured by the Overall Vulnerability Score in a Vulnerability Assessment and Management (VAM). This score is the result of assessing various elements, including each vulnerability's criticality, possible impact, exploitation, and severity. Metrics like the Common Vulnerability Scoring System (CVSS) scores, which grade vulnerabilities according to their effect and ease of exploitation, are also included. The overall vulnerability score aids in prioritizing repair activities by offering a consolidated view of the organization's risk exposure. This helps direct resource allocation to address the most urgent security concerns and improve the organization's overall security.
Overall Vulnerability Score - Trend:

The Vulnerability Score Trend tracks changes in the overall vulnerability score over time, showing how the organization's risk posture evolves. This trend helps assess the effectiveness of remediation efforts, identify recurring issues, and evaluate long-term security strategies. By analyzing these trends, organizations can gauge improvements in their security posture and make informed decisions to enhance cybersecurity.
Vulnerability Scans:

Running Scans - Indicates how many scans are running
Completed Scans - Indicates how many scans were completed
Assets Scanned - Indicates how many assets were scanned
Vulnerabilities by Severity & Asset Type:
 The charts displaying "Vulnerabilities by Severity" and "Vulnerabilities by Asset Type" provide a comprehensive breakdown of identified vulnerabilities within an organization. The "Vulnerabilities by Severity" chart categorizes vulnerabilities into critical, high, medium, low, and informational levels, offering a clear view of their distribution based on their severity. This classification helps in prioritizing remediation efforts according to the risk they pose. Meanwhile, the "Vulnerabilities by Asset Type" chart illustrates the count of vulnerabilities detected across various asset categories, such as web assets, network assets, and mobile assets. This chart allows organizations to understand which asset types are most vulnerable, facilitating targeted risk management and more effective allocation of security resources. By visualizing these metrics, the charts assist in identifying patterns and trends, ensuring a strategic approach to enhancing overall security posture.

- To view detailed information about each vulnerability and its scan location, click on any colored segment of the graph or chart. This action will open a modal displaying comprehensive details including the CVE identifier, severity level, target, asset name, and URL associated with the specific type of severity scanned.

Top CVEs Detected & Top Vulnerable Assets:

The Top CVEs Detected and Top Vulnerable Assets provide crucial insights into an organization's security posture by identifying prevalent vulnerabilities and at-risk assets. The Top CVEs Detected report highlights the most frequently found Common Vulnerabilities and Exposures (CVEs) within the organization, focusing attention on the most common and potentially severe vulnerabilities that need immediate remediation. In contrast, the Top Vulnerable Assets chart identifies which specific assets are most frequently affected by vulnerabilities. Together, these metrics enable organizations to prioritize their security efforts by addressing both the most critical vulnerabilities and the assets most susceptible to threats, thereby improving overall risk management and resource allocation.

- Clicking on one of the top vulnerable assets reveals a detailed scan history for that asset. This comprehensive view includes information such as the CVE identifier, severity level, CVSS score, URL, and asset name. Unlike the summary view, which displays only average severity, average rating, and the number of vulnerabilities scanned, this detailed view provides a deeper insight into each specific vulnerability associated with the asset.
If you need further assistance, kindly contact our support at info@cytechint.com for prompt assistance and guidance.
Virtual Penetration Testing
Overview
Welcome to the Virtual Penetration Testing module. In this section, you'll be guided through the process of using our virtual penetration testing tool. You'll learn how to:
Virtual penetration testing is a remote security assessment method designed to evaluate the vulnerabilities and weaknesses within digital environments, including web applications, networks, and systems. By simulating potential attacks using various tools and techniques, this method helps identify security flaws and assesses the effectiveness of current defenses. Unlike traditional in-person testing, virtual penetration testing is conducted over the internet, offering flexibility in testing locations and often reducing costs. The primary aim is to detect and address vulnerabilities before they can be exploited, providing valuable insights to enhance your organization’s security measures.
Navigate to the module

- After redirected, it will show you the modules under risk management then click Penetration Testing.

Create a Penetration Test Scan
- To create a penetration test you will be already redirected to the scan page when you click the Penetration Testing, as shown below you just need to click New scan.

- After clicking scan it will show you all the type or testing categories you can do and every category it will show you the tools you can use for your testing.
- for example, the image shows that the user chooses Network penetration testing, the tool he/she can use are Nmap & NmapUDP are for (port scan), then OpenVAS is for (Network Vulnerability Scan). After you pick/choose click Next.

- When clicking next, it will guide you to the next step which is Selecting Targets. in this section it allows you to add or select target that is already existing on the list. Note that there is limitation on adding targets. (3) targets only is allowed.

- If the target you need to test is already exist just click the check box beside the targets name, then if it doesn`t exist yet you can click the " Add Target " in the upper right to all new target.

- If ever your target doesn`t exist on the list, you can just simply click +Add Target then a modal will show for you to input the target then click add target to submit the target credential, then it will automatically show the added target on the dashboard and you can proceed on clicking next for step 3.


- On the 3rd step, it will ask you when will the will the scan happen, and the type of notification you want to receive. The image shown below are the options you have when configuring your penetration scan.


- Step 4 shows you the overall set up of your penetration scan for you to review if all the details you provide is correct before Running the Scan.

Penetration Test Scans Dashboard:

In the Penetration Test Scans dashboard, it shows all Penetration Tests that were conducted. It shows the completion of the test, whether it has finished the scan or not. It also shows the website where it has conducted the test as well as the different types of severity for the vulnerabilities & risks the penetration has scanned.
Virtual Penetration Report Dashboard:
- This shows the user all the list scans done on the targets.


Virtual Penetration Testing Reports:
- There are multiple ways to Generate or get the report for your Virtual Penetration Testing, you can view it on the Scan Dashboard and also in Reports Dashboard. In this part it will show you all the option you can get or view the outcome of your scan/test.
View/Generate Scan Report in Scan Dashboard:

- When you are on the Scan dashboard you can also View/Generate report on the specific scan you made by clicking "Report" button on the specific scan you want.

- After clicking the "Report" button, it will show you the report of the scan with different functionalities like "Save", "Download", and " Print".
View/Generate Scan Report in Report Dashboard:

- In this part the other way you can View/Generate report is on the Report dashboard. but in this part, there are two way you generate, it's by clicking "New Report" and "View" button. Below, it will show you both option and its functionalities.

Top Vulnerabilities Detected:

Top Vulnerabilities Detected provides a visual summary of the most critical vulnerabilities identified during the test. It typically ranks these vulnerabilities by severity or impact, highlighting which ones pose the greatest risk. The graph often categorizes vulnerabilities by type or affected system areas, such as web applications or network services, and may show their frequency of occurrence. This helps prioritize which vulnerabilities need immediate attention and provides insight into the overall risk landscape. Additionally, if the graph includes data over time or across different test phases, it can help track trends and assess whether security improvements are being made. Overall, this graph is an essential tool for understanding and addressing the most significant security threats uncovered in the penetration test.

- Clicking on any section of the graph triggers the display of a modal that provides detailed information about scans that have identified a top vulnerability. This modal presents a comprehensive overview, including the target of the scan, the type of vulnerability detected, the date of the penetration testing, and the current status of the vulnerability. This detailed view helps users understand the context and specifics of each detected vulnerability, facilitating more informed decision-making and prioritization.
Recent Penetration Test:

Recent Penetration Test refers to the latest assessments performed to evaluate the current security status of your system. These tests identify and analyze vulnerabilities, helping you understand recent threats and improvements. Reviewing recent tests ensures your defenses are up-to-date and aligned with the latest security risks.
Top Exploitable Assets:

Top Exploitable Assets refer to the most vulnerable components of your system identified as having the highest potential for exploitation by attackers. These assets are prioritized based on their risk level and ease of exploitation, helping you focus on addressing the most critical weaknesses to enhance your overall security.

To access detailed information about vulnerabilities from a penetration test, click on any item in the "Top Exploitable Assets" list. This action reveals a comprehensive view of the scan, including the types of vulnerabilities detected and their severity levels. The modal also displays scan details such as the start and end times, duration, and sources of the test. Additionally, it provides specifics on vulnerability types, affected hosts, paths, insertion points, and overall severity, offering a thorough understanding of the identified security issues.
If you need further assistance, kindly contact our support at info@cytechint.com for prompt assistance and guidance.